01
Capacity and utilization
See where teams are busy, underused, overloaded, or approaching burnout.
- Team utilization
- Labor capacity
- 12-month trends
 Operations Analytics
Cognition360 helps ConnectWise MSPs analyze service delivery, ticket lifecycle, technician utilization, common issues, and capacity so leaders can improve the machine instead of guessing where it rattles.
OPERATIONS
Cognition360 turns capacity, utilization, service delivery, projects, account management, and recurring issue patterns into operational analytics for MSP leaders.
01
See where teams are busy, underused, overloaded, or approaching burnout.
02
Track tickets opened, closed, aging, and active by day, type, team, and customer.
03
Use Type/Subtype/Item analysis to identify recurring problems, training needs, automation opportunities, and project candidates.
OPERATING RHYTHM
Use operations analytics to decide where to intervene across people, process, client behavior, project delivery, and service scope.
Track tickets, labor, utilization, realization, capacity, CSAT, and service metrics from ConnectWise data.
Find the teams, technicians, clients, or ticket types creating unusual volume or effort.
Use common issues and lifecycle views to understand why work is repeating or getting stuck.
Coach the team, adjust staffing, automate a recurring issue, revise client expectations, or create a project.
Watch the metric over time to confirm the fix changed the trend.
SERVICE DELIVERY
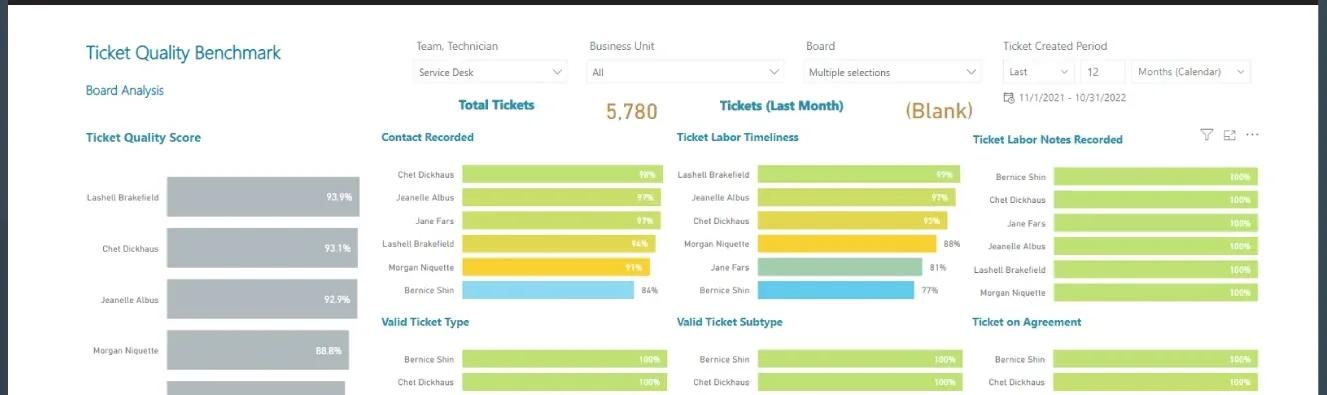
A full ticket queue can look like growth until leaders see utilization, capacity, recurrence, and profitability together. Cognition360 helps teams understand whether service activity is creating value or quietly consuming margin.
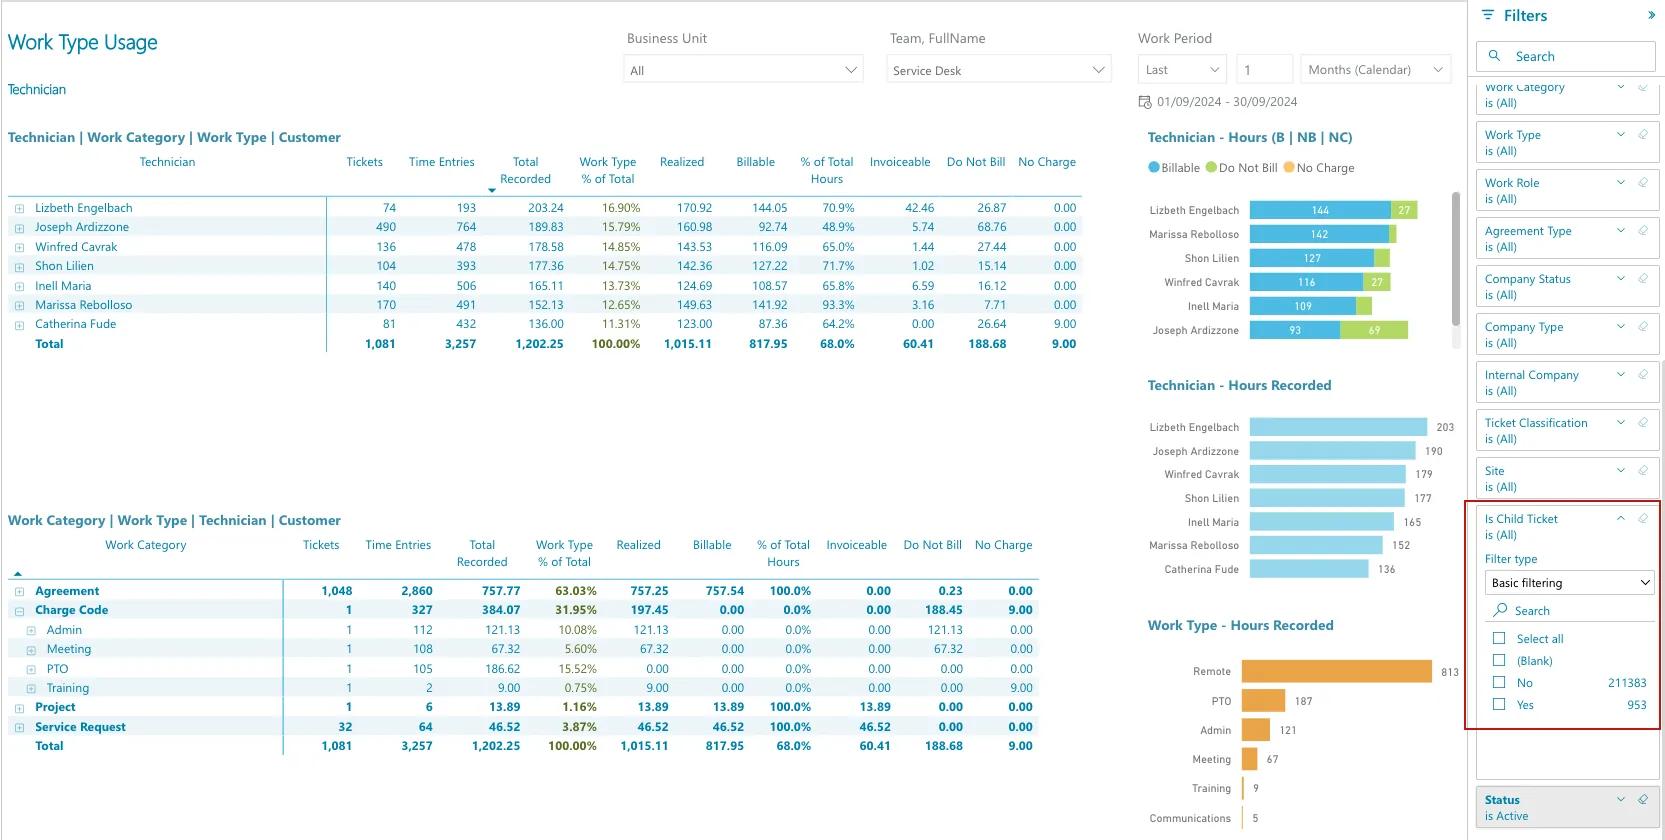
Measure staff efficiency and utilization across customer tickets and labor.
Understand which teams and resources have capacity for new work.
Track opened, closed, and active ticket patterns over time.
See heavy-touch accounts and end-user patterns by customer.
Turn repeated ticket categories into training, automation, or project opportunities.
READY?
See how Cognition360 helps ConnectWise MSPs tune service delivery and capacity planning with operational data.