

Reporting can sometimes feel like a chore—pulling numbers, copying and pasting data, building slide decks.
But when it’s done right, it’s actually one of your best opportunities to demonstrate your value as a strategic partner. So how do you turn routine QBR reporting into something clients actually remember and act on?
Conventional wisdom says the best QBR reporting is high-level: “Stick to the headlines. ” But the data tells a different story. According to our recent survey of 1,100+ MSPs, top-performing MSPs—those with lower churn, higher CSAT, and stronger revenue growth—are actually more likely to share a broader range of metrics with their clients, not fewer.
That doesn’t mean more data is always better. In this guide, we’ll show you how to strike that balance—from choosing and framing the right data to structuring a productive conversation and tailoring your reporting to different client segments.
Where Reporting on Operational Metrics Falls Short
Tickets closed, SLAs met, uptime percentages, CSAT scores—these metrics are staples of MSP reporting because they offer useful snapshots of service performance and are relatively easy to pull into a report. But on their own, they mostly answer one question: “What did we accomplish?”
The more important question clients ultimately need answered is, “What are the strategic implications for our business?” That distinction can transform QBR reporting from an exercise in proving how busy your MSP has been into a real demonstration of the value you’ve created.
Below, we break down how to do it.
Make Reporting on Operational Metrics More Strategic
Our research found that top-performing MSPs tend to report on a broader range of metrics. But even more crucially, they provide context around how results were achieved, rather than simply reporting the end result.
1. Tie Metrics to a Broader Story
Whatever metrics you include, the key is to attach a clear “so what.” A faster resolution time matters because employees spend less time waiting on IT. Improved uptime matters because it means fewer hours of lost productivity.
2. Include the Implications of Risk
The same principle applies when reporting on risk. Rather than simply flagging an end-of-life device, security vulnerability, or compliance gap, translate that risk into potential business exposure. What could happen if the issue isn’t addressed? Could it lead to downtime, lost productivity, compliance penalties, or loss of customer trust?
3. Balance Past Performance with Future Planning
Don’t just report what happened last quarter. Surface upcoming investments, risks, and technology needs early enough for clients to plan for them.
4. Turn Insights Into Clear Next Steps
Pair your findings and projections with strategic recommendations, clear ownership, and timelines. That way, your QBR report becomes a tool for deciding what happens next. To help accelerate your QBR reporting, use an AI tool to help provide a summary or recommendation based on your data.
Examples Of How To Transform Operational MSP Metrics Into Strategic Insight
Here are some examples of how standard MSP reporting can be elevated into more strategic, business-relevant insight.
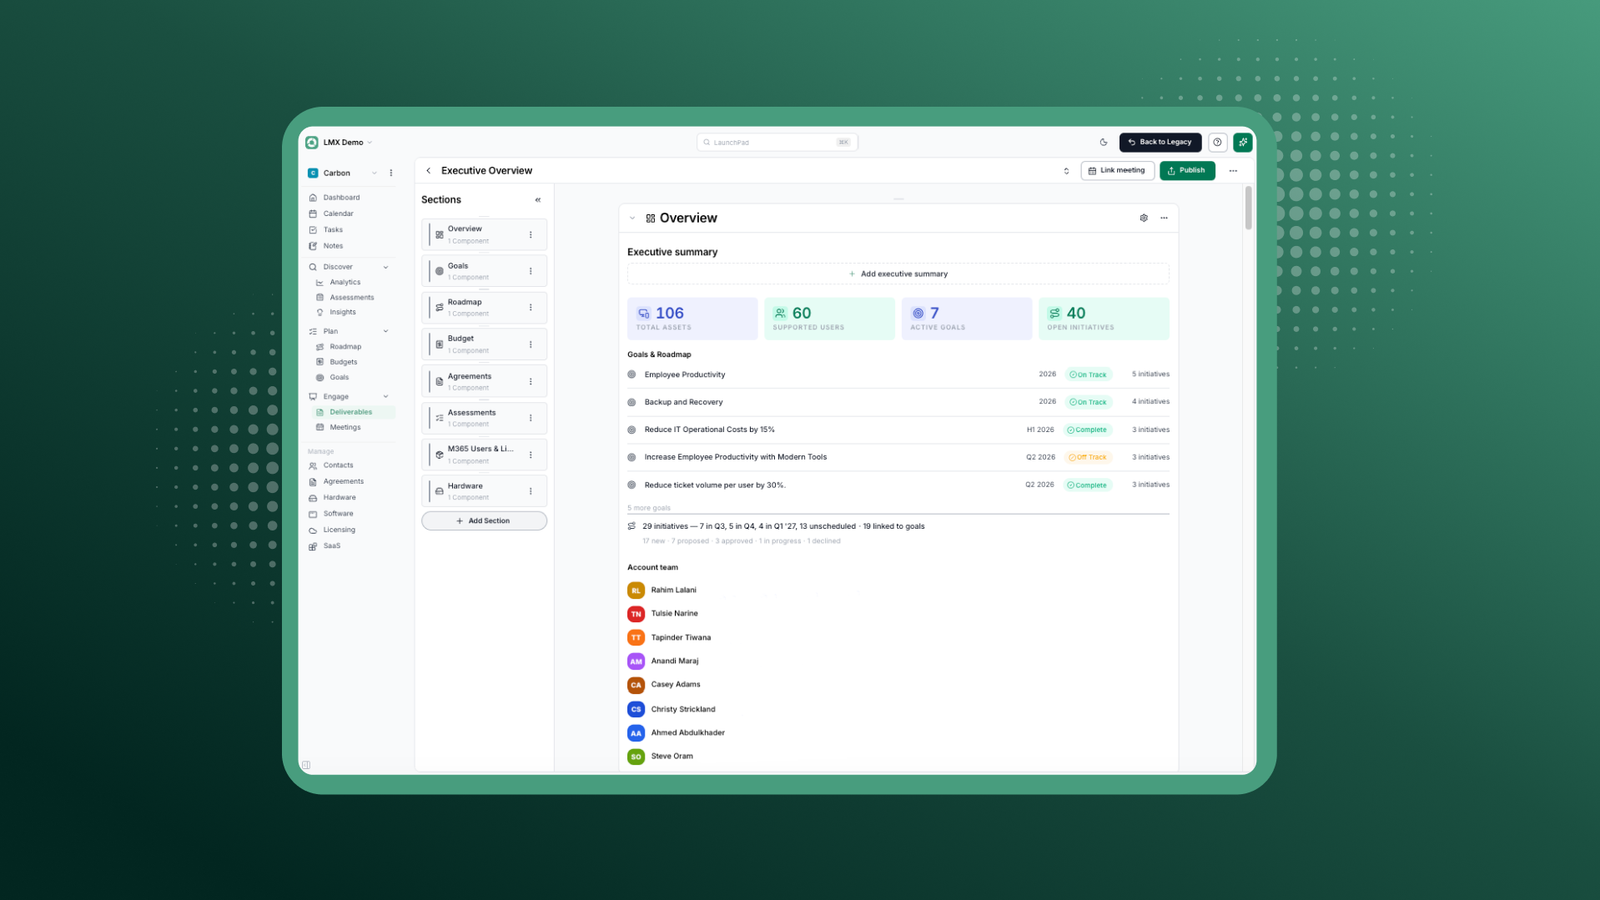
Overview
Your client, Carbon, has 106 managed assets supporting 60 users, with 7 active goals and 40 open initiatives on the roadmap covering Q3 2026 through Q2 2027. Your last technology alignment assessment gave them strong marks for business applications, strategic planning, and operational excellence. Foundation Services is their weakest area driven by gaps in network infrastructure, backup/recovery, and cloud services.
Key talking points for your next QBR: Start a discussion around the gaps in Foundation Services, an area introducing unnecessary risk. Bring up the business impact of a possible outage or backup failure in terms of measurable downtime, data losses, and/or hits to productivity.
Ideal outcome: Get buy-in to start addressing these issues proactively, before they become problems.
Goals and Delivery
Overall, Carbon is making good progress on goals related to operational costs, security, and employee productivity goals but could spend more attention on training in modern tools (Q2 2026), which is currently listed as “off track.”
Key talking points for your next QBR: Revisit the goal around “Increasing Employee Productivity With Modern Tools” and try to understand the challenges your client Carbon has been facing. Listen first, then see how you can best offer support. For instance, see if any changes need to be made to the goal itself to make it more realistic, or consider breaking the existing goal into smaller, more manageable steps.
Ideal outcome: Commit to taking one small step together to move this goal forward before the next meeting.
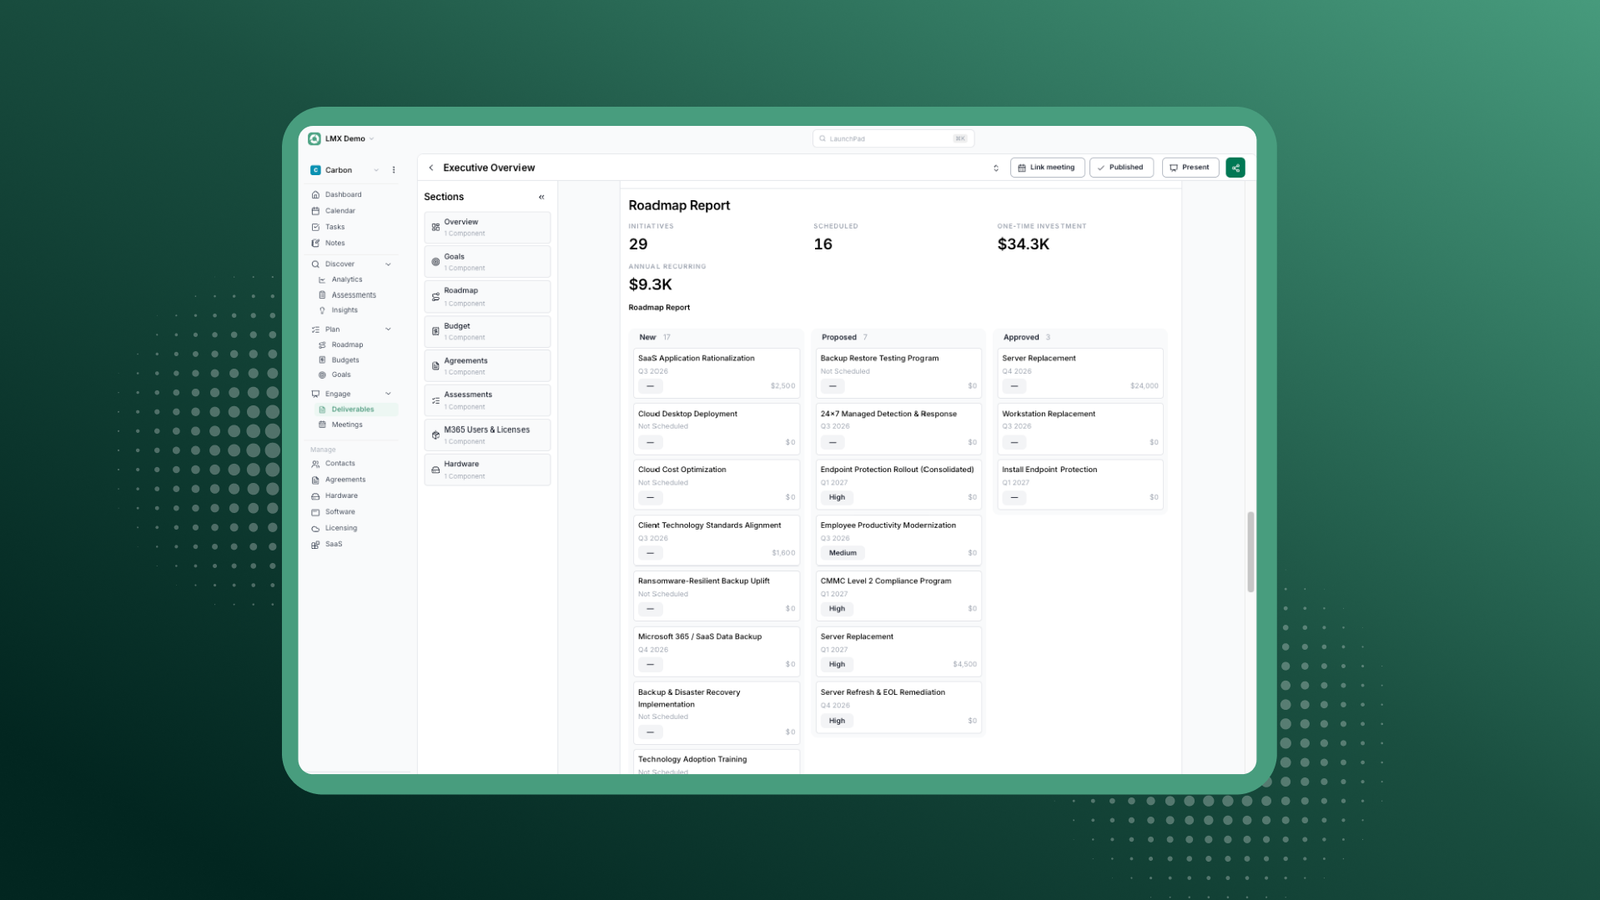
Key Initiatives and Investment
Carbon currently has 29 initiatives, but only 16 scheduled—with some big projects, like CMMC Level 2 Compliance Program and Endpoint Protection Rollout, proposed for Q1 2027. These are critical next steps for Carbon’s compliance program.
Key talking points for your next QBR: Start a discussion with senior management around the proposed but not yet approved initiatives around compliance (CMMC Level 2 and Endpoint protection). If they don’t achieve these compliance goals by their deadlines, what real business outcomes are at stake? Will they lose contracts, insurance coverage, or put themselves at risk in any other way? Highlight the importance of acting early to avoid these costs.
Ideal outcome: Get executive approval on key compliance initiatives so they can start at the beginning of the year, as planned.
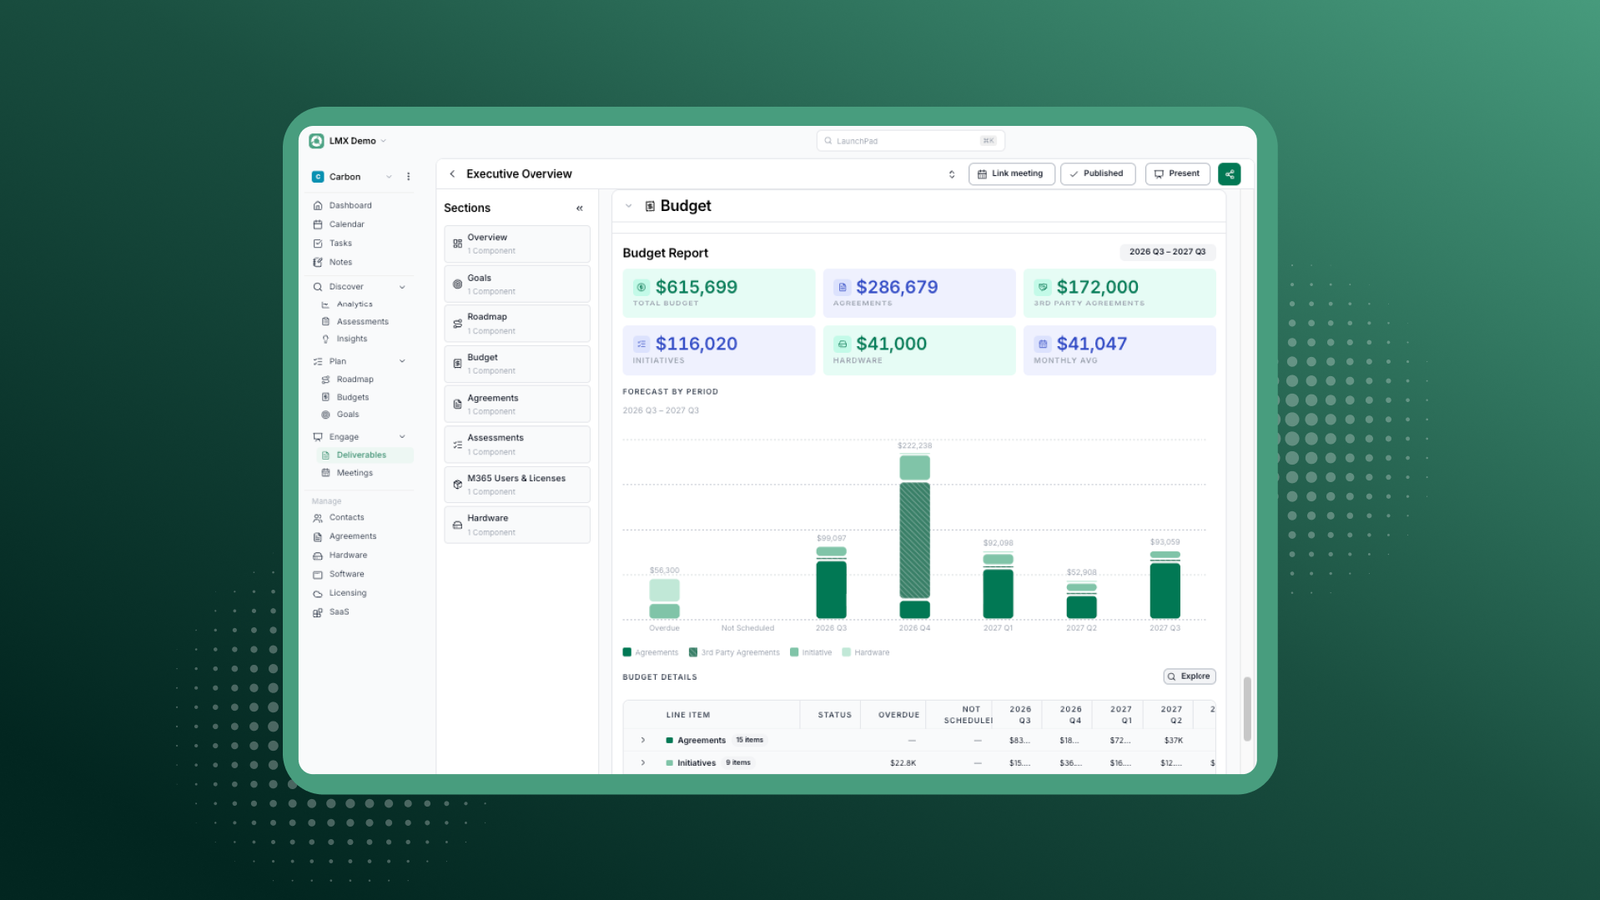
Budget Outlook
Carbon has some big, upcoming expenses. Q4 2026 is the heaviest quarter at roughly $184.7K in contracts plus 36.1K in initiatives, driven by the approved Server Replacement ($24K) and third-party renewals (property lease $130K, VoIP $24K). Meanwhile, Overdue IT debt stands at $22.8K in initiatives plus significant hardware debt (about $33.5K across workstations, desktops, and network gear), mostly aging Lenovo/HP equipment past retirement dates.
Key talking points for your next QBR: Review the Q4 spend plan with the team and address any budget concerns. If time allows, start a discussion around the technical debt—while it poses risk, it may be difficult to address immediately, due to the large upcoming expenditures. Before the meeting, build out a proposed hardware replacement plan that spreads the costs over multiple quarters, so Carbon can see how they can tackle their backlog in a financially sustainable way.
Ideal outcome: Lock in Q4 spend plan (server replacement plus renewals) and address contract renewals expiring in the next 30-60 days. Leave Carbon with a proposed hardware replacement roadmap to consider before the next meeting.
Next, we’ll show you how to put those insights together in a way that prompts effective conversations with your clients.
Structuring Your QBR to Flow Naturally
Beyond choosing and framing the right data, effective QBR reporting is about organizing those insights into a conversation that moves naturally from reflection to decisions and action.
1. Start With the Client’s Priorities
Open by grounding the conversation in the client’s goals and priorities. Flag any new risks or developments, and revisit commitments made during the last QBR so everyone starts with the same context.
2. Show Progress, Not Just Status
Rather than simply presenting where things stand today, show what has changed since your last QBR and what that movement means for the client.
If you’re using Lifecycle Manager, you can run an assessments comparison report in deliverables to see how they've progressed over the last few quarters and what gaps still remain. These comparisons give individual metrics more context and make progress (or emerging problems) easier to see.
3. Make Recommendations
Connect what you’ve uncovered to what you recommend doing next. Give each recommendation a clear owner and timeline so the conversation moves from reporting on information to acting on it.
4. Look Ahead
Give clients visibility into what’s coming up on their technology roadmap, including investments, renewals, refreshes, or risks they should start preparing for now.
Top-performing MSPs are significantly more likely to take this longer view: 37% build 12–24 month technology roadmaps for clients, compared to just 20% of non-top performers. Looking ahead helps shift the conversation from reacting to immediate needs to proactively planning and budgeting for what’s next.
5. Close With a Commitment, Not a Summary
Instead of ending by recapping what you just discussed, close with one or two concrete next steps. Whether that’s an approval, an action the client will take, or something your MSP will deliver, the client should leave knowing exactly what happens next.
This 5-step flow can provide a useful backbone across your client accounts. But while the overall structure can stay consistent, the topics you emphasize within it should flex based on the client and conversation.
How to Customize QBR Reporting for Each Client Segment
Choosing the right insights and the order to share them in are the first two layers of customization. What you emphasize and how deeply you go into each topic should also reflect the client’s goals and who’s in the room.
Segment by Client Goal, Not Just by Size or Industry
A client’s priorities can be a stronger signal of what to emphasize than their size or industry.
- Growth-focused clients: Focus on roadmap progress, technology enablement, productivity impact, and headcount or capacity planning.
- Risk-focused clients: Prioritize security posture and trends, open vulnerabilities, end-of-life device exposure, and incident response readiness.
- Cost-focused clients: Emphasize ROI, cost avoidance, efficiency gains, and what your work has prevented—and what those issues could otherwise have cost.
- Compliance-focused clients: Highlight framework progress, evidence completion rates, policy status, and audit readiness timelines.
Match the Depth to Who’s in the Room
There’s no universal right level of detail. Often, a tighter report can be more impressive than a comprehensive one because it demonstrates that you know which information deserves the client’s attention.
- Executive stakeholders (CFO, CEO, owner): Lead with outcomes, decisions, and what’s next. Avoid raw technical data unless you translate its business significance.
- Technical stakeholders (IT manager, ops lead): More operational depth is appropriate, but every metric should still connect to a business implication.
- Mixed rooms: Lead with outcomes everyone needs to understand, then go deeper where useful.
The Best QBR Reporting Makes Clients Feel Understood
Ultimately, the goal isn’t the most comprehensive QBR reporting, it’s the most relevant reporting. One of the clearest signs of a great QBR report is when a client references something from it in a conversation weeks later, unprompted. That’s how you know that you’ve meaningfully influenced how the client sees their own business and that they trust your framing to help them take their business to the next level.
The best reporting leaves clients feeling understood—like you understand not just their tech stack, but their business, priorities, and where they’re trying to go.