ScalePad presents its third annual MSP Trends Report. See how top-performing MSPs grow revenue, drive customer success, and scale operations — backed by data from 1,100+ peers.
As a cold chill settles upon the north of the land, the moonless solstice approaches with the nights growing ever longer… the ScalePad team has our last updates of the year for Cognition360! Bet you’re glad I didn’t keep that prose up.
As a triple play would close out any inning (yes, I’m switching back to a summer sport analogy… I just couldn’t do a triple lutz, can’t ski a triple-black diamond), we’re here closing out 2025 with three updated reports:
Company Audit Analysis Report
Customer Profitability Report
Ticket SLA Insight Report
As per usual with Cognition360 updates, they’re available to be added to your tenant on a request basis. Jump on this linked Jotform to request any or all of the reports we go through here be updated for you.
And read on for all the details!
How may I get a deeper look at what’s new?
Join the ScalePad Cognition360 team for our Cognition360 Learning Lab on this – interactive so you can ask your questions (and be sure you add the report into your tenant so you can ask really difficult questions). The impending holiday season means the next session will be happening January 28, 2026. Note that ScalePad’s annual Ignition event is the next day as well; keep your calendar free for ScalePad events at the end of January!
If you’re not already joining us for our Learning Lab, get on this – it’s essentially a C360 peer group led by an expert MSP consultant, well worth your time. Usually it’s the legendary Christy, but sometimes someone like Adam or Kaitlin takes the reins.
What’s new-and-or-improved in these three reports?
Let’s get right into it:
Company Audit Analysis Report
This is an all-new, never-before-seen report.
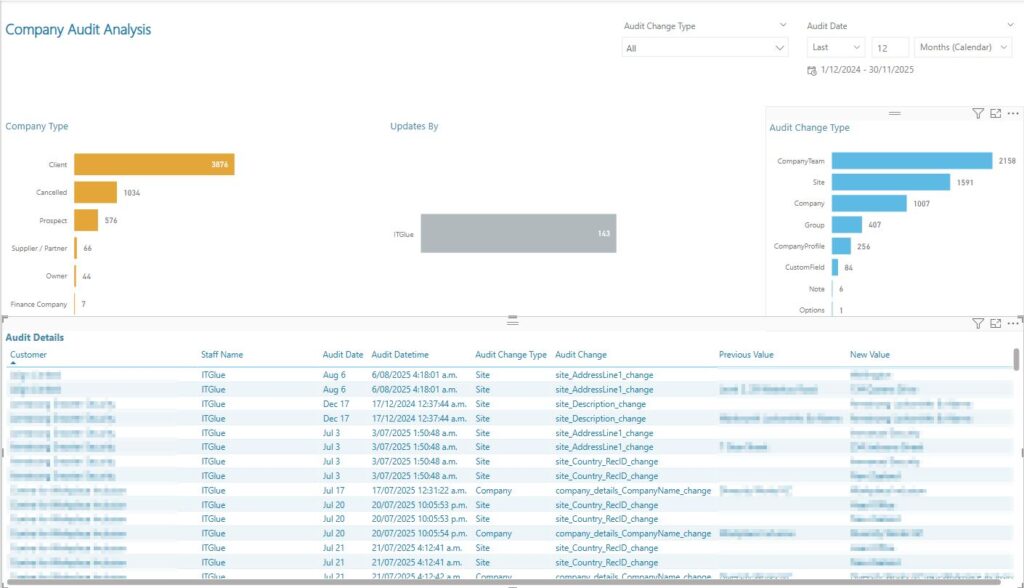
Company Audit Analysis Report (with many redactions) | Audit Details page
Partners had expressed a challenge with limited visibility into how frequently company records are updated, and what specific changes are occurring. This made audits and troubleshooting more difficult, because the user couldn’t be clear on exactly which changes had been made when.
Our solution is the introduction of a new Company Audit Analysis Report. This report captures both the frequency of the changes, as well as the actual audit entries. Data can also be extracted from the report for deeper analysis or inclusion in compliance workflows.
The example we have above shows updates made to Site and Company records by their documentation tool, ITGlue.
Customer Profitability Report
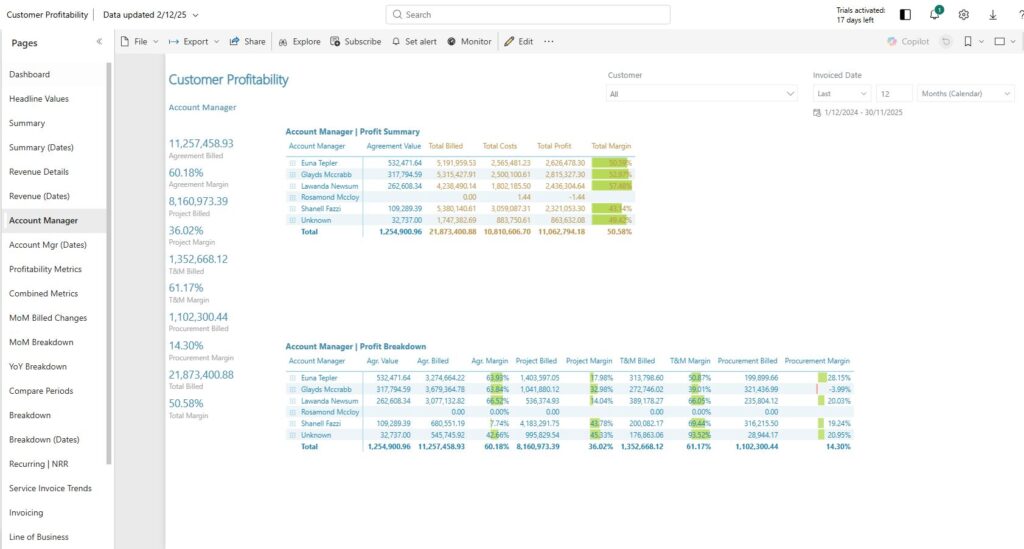
Added Agreement Value to the Account Manager and Account Mgr (Dates) pages of the Customer Profitability Report.
Customer Profitability Report | Account Manager page with new “Agreement Value” column
Comparing agreement values vs actual billings is a potential blind spot. Of course, the expectation is that billing would match exactly what’s in the agreement, right? Surely no one has ever had an issue with this ever because systems are infallible.
Despite infallibility, this seemed like a legitimate potential problem our reporting could help with, so we’ve added the total agreement value to both the Account Manager and the Account Mgr (Dates) pages:
Customer Profitability Report | Account Mgr (Dates) page with new “Agreement Value” column
Now you can compare current agreement values against total billings to evaluate ACTUAL MRR and profitability on a per client basis, as well as look at MRR per account manager. Billing discrepancies are obviously something you’d want to clean up as quickly as possible; discounts shouldn’t be inexplicable or outside agreements, and overbilling is a potential reputation hit. We can help you spot these issues.
Ticket SLA Insights Report
Added CompanyType filter to the Ticket SLA Insights Report.
You may have a number of different Company Types set up to cover different kinds of organizations in your service offering, or work that you do outside of managed services. I can understand a use case to look at delivery vs SLAs for hourly clients, for example, or perhaps your hourly clients might have questions for you about how you’re meeting SLAs.
This filter gives you a quick way to segment SLA performance by Company Type and derive improved insights based on client categorization.
If you are already working with Cognition360, please feel free to share your thoughts on this post on our Community site; we appreciate hearing from you. Many of the updates (I think literally all...) in this release were inspired by support requests and real challenges raised by ScalePad Partners like you. Let us know what you need or what could make your experience better, and we will be ready to support you and help your business grow.
Still not a Cognition360 partner? If you have ConnectWise PSA, resolve (because New Year’s resolution… amirite?) to join us for a personalized demo, or check out this quick overview here. We’d love to help you unlock insights hidden in your data so you can make better decisions and grow a more efficient and profitable MSP business in the New Year. Cheers!
Not quite as many updates as we had in June, but our September update has new data / columns / pages / filters on several reports that add useful capabilities. Read on to get the details!
You’re certainly using the Sales and Opportunity Dashboards (really should be if you’re not; they’re core reports for a reason…), and there are multiple updates on these Dashboards. Really, we’ve added some interesting capabilities across the board here, and feel we’re scoring a perfect 5/7.
Christy Strickland and I collectively decided it’d be better to dedicate a future session of our Cognition360 Learning Lab (linked here so you can register) so you can ask questions instead of dropping in a video. The session later this month (September 24, 2025) is going to be on Ticket Labor Analysis and Ticket Lifecycle, so this What’s New session will be happening October 22, 2025.
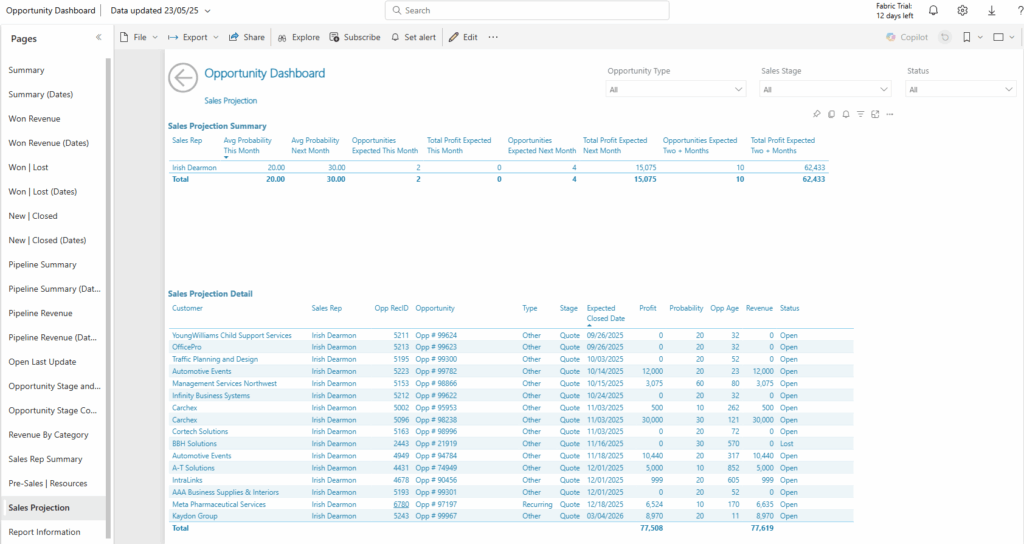
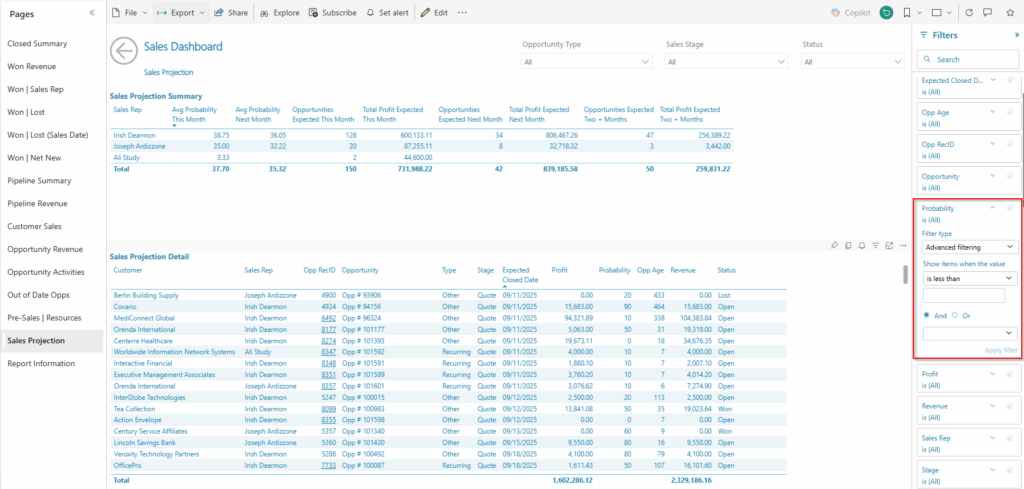
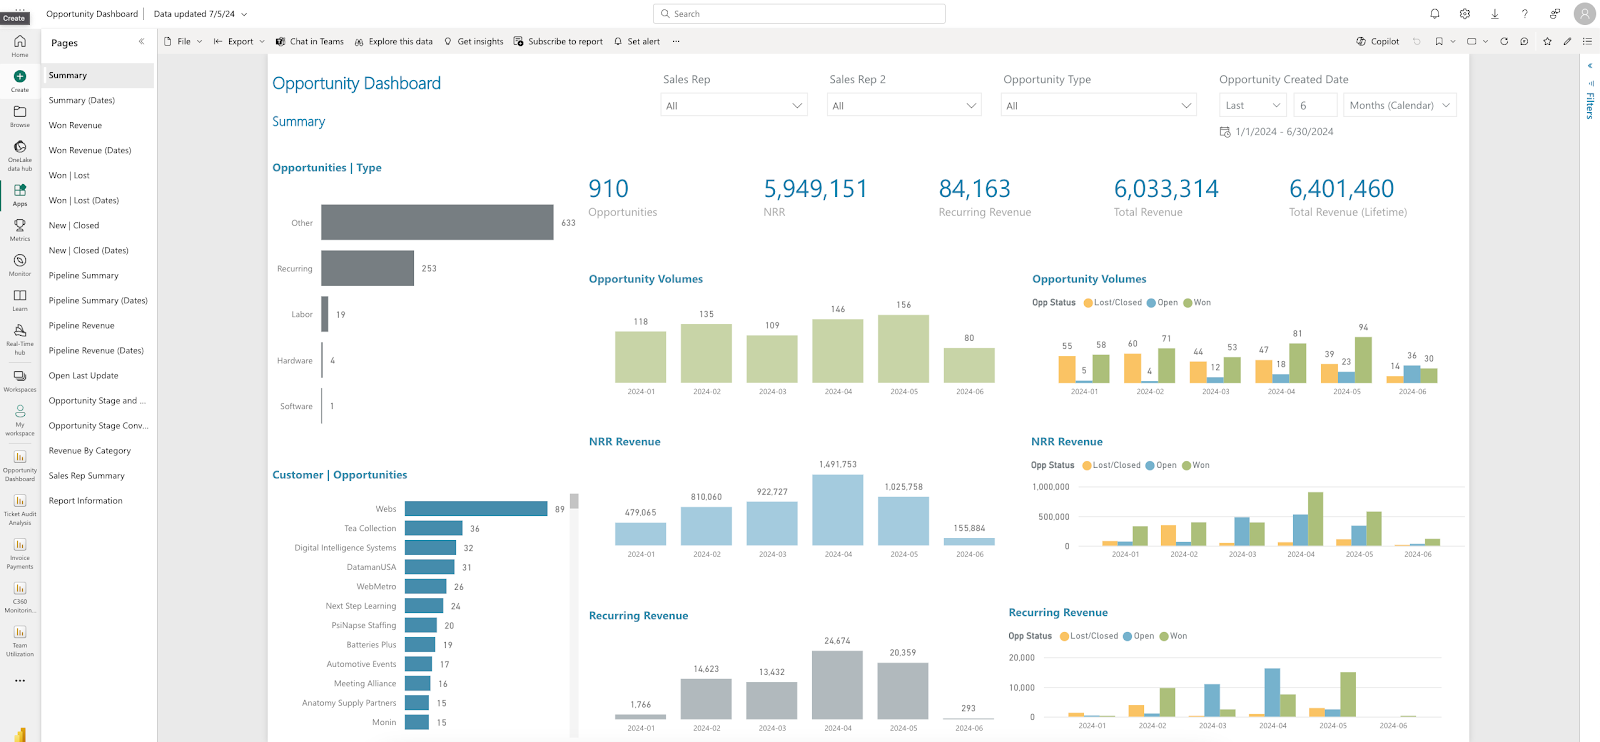
A new Sales Projection page has been added to both the Opportunity Dashboard and the Sales Dashboard.
Opportunity Dashboard | Sales Projection page
The new Sales Projection page shows the weighted projections for current month, next month, and next 2+ months by both Sales Rep and Customer, at both a summary and detail level.
Sales Dashboard | Sales Projection page with the Probability filter highlighted
We think you’ll get the most value from the projections by using the probability filter. This allows you to include or exclude opportunities in your projections that meet a selected cut-off threshold. Most MSPs will only choose to include an opportunity in their projection if it has >70% probability of closing. Our example above would only have three opportunities that would meet this threshold, so the filter gives you a much better projection on expected business.
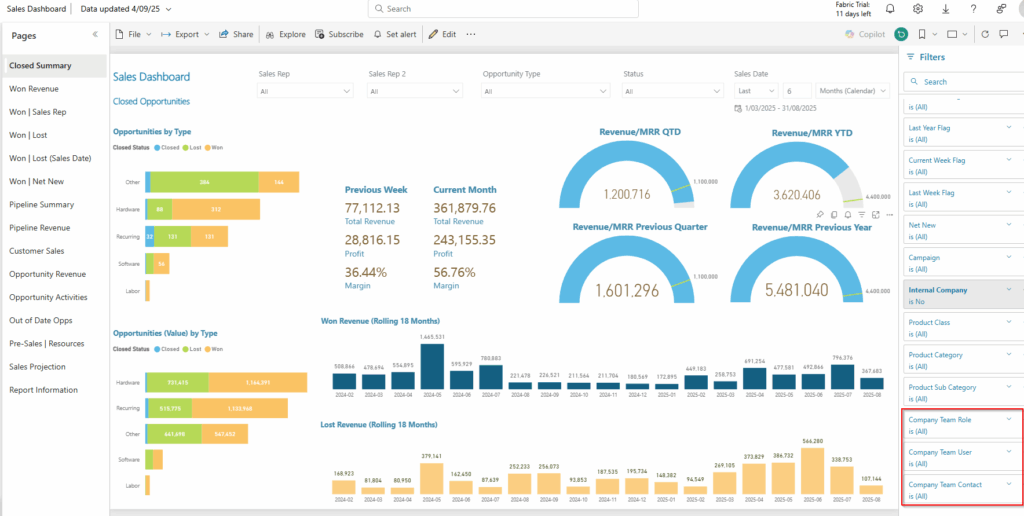
New filters for Company Team information 🧑🤝🧑
Company Team info has been added as filters to the Sales Dashboard:
Company Team Role
Company Team User
Company Team Contact
Sales Dashboard | Closed Summary page with the Company team filters added and highlighted
The purpose here is to be able to filter an opportunity by any member of the team. Suppose five new clients came on; which account manager / lead engineer should they be assigned to? If you have teams set up in CW, this should be useful for you. You can also use this filter to audit Company Team in just one screen, saving you a lot of time and effort versus doing this one-by-one in Manage.
You can also dig into the data in reverse, and examine all tickets that had no time, and get into why – is the team missing adding time entries that should be there?
Final important note: if you have renamed the Account Manager Role in Company Team to anything other than 'Account Manager', please reach out to our Support Team. We can then ensure it’s mapping properly.
New filter for New Business Flag 🚩
New Business Flag has been added as a filter to the Sales Dashboard. The 'New Business Flag’ is calculated using days from when a company has been acquired (Company Acquired Date) to when it has become a lead in opportunities.
Sales Dashboard | New Business Flag shown in data model
There are a few intricacies on using the New Business flag and getting it set up. First, there is a requirement of a days threshold business rule to be set up before the flag will work correctly. This is a business rule set up in the Cognition360 report database by our team, and there will be a little back-and-forth required communication wise on this – our Support team will need to know the threshold for us to set it up for you. If you choose to add the New Business Flag, you will need to contact our Support team directly.
That caveat aside, the Flag adds some useful filters. For example, you could look at every new client that came onboard last year / quarter / month / week and see what they’ve bought.
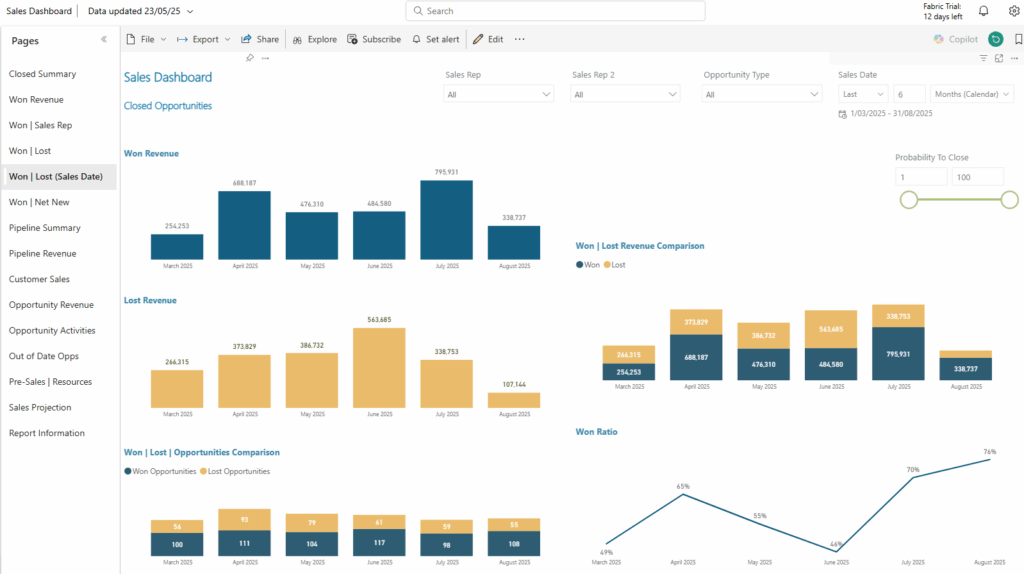
Won | Loss (Sales Date) 📆
We’ve added a new page called Won | Lost (Sales Date) to the Sales Dashboard:
Sales Dashboard | new Won | Lost (Sales Date) page
The new page shows Won and Lost Opportunity revenue and number of Opportunities within the closed date time period. There’s also a handy graph in the bottom left where you can see the ratio to compare won to lost opportunities charted by month in our example.
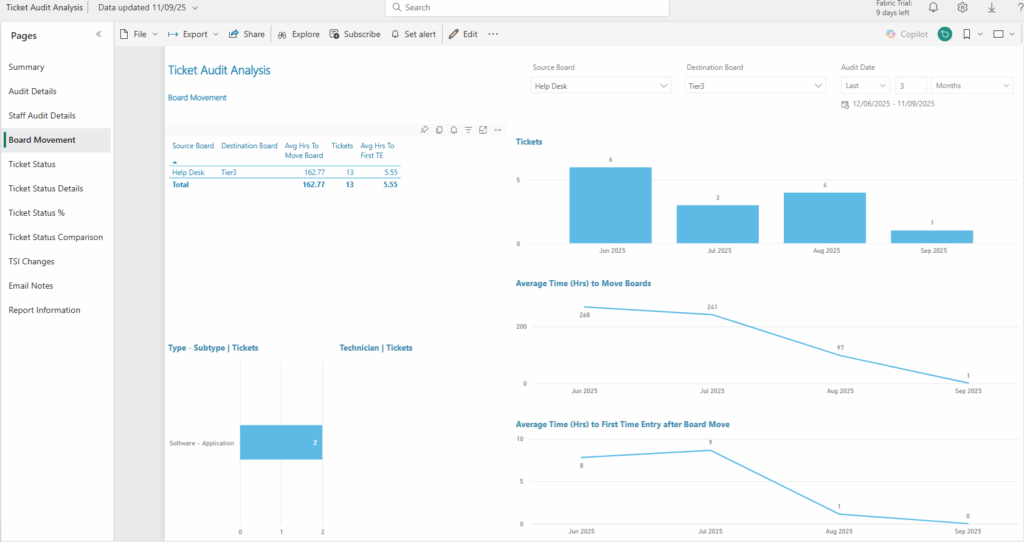
Board Movement for Ticket Audit Analysis 🎫
The Board Movement page of the Ticket Audit Analysis report has been enhanced for better analysis.
Ticket Audit Analysis | Board Movement page with added Avg Hrs to Move Board and number of Tickets
The report now includes the number of tickets and average time by month and week, by ticket type and subtype, and by technician when tickets are moved from a source board to a destination board. We’ve added “Avg Hrs To Move Board” and “Tickets”.
The granularity provides a lot more sort options, and you can now see the average time that each ticket sits on a board for. This is a great enhancement to your analysis of service delivery; for example, looking at moves from Help Desk to Escalation.
How many escalation tickets did we move?
How long did it take to escalate from the source Help Desk board?
How long were we sitting on the Help Desk ticket?
If you use a ‘Triage’ board as a single intake point, this addition can assist as a useful efficiency measure to see how your dispatcher / service coordinator is doing in assigning out tickets.
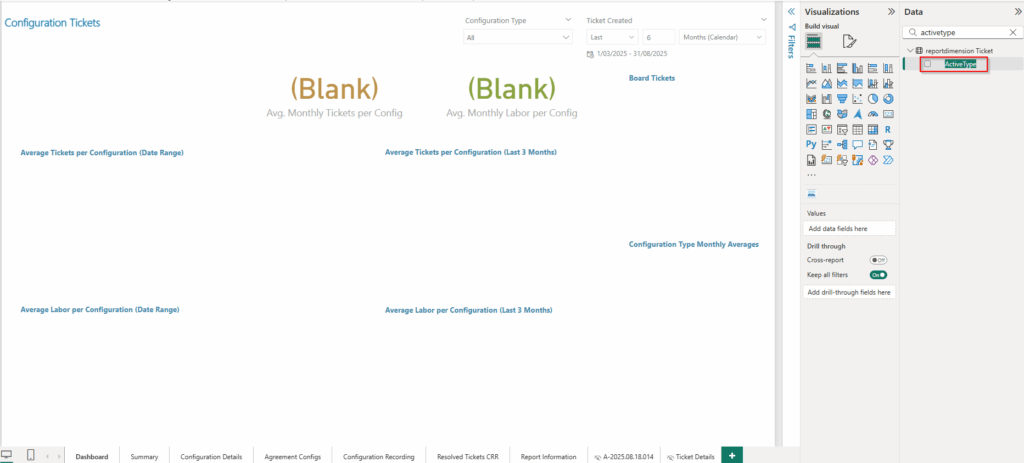
Ticket Type (ActiveType) to Configuration Tickets Report 🎟️
The data model for the add-on Configuration Tickets Report has added a new dimension:
Configuration Tickets Report | Ticket Type added to data model
Visually, not a ton to see here as we don’t have configuration tickets populated in our demo environment, but this will allow users to identify the ticket configurations by Reactive or Proactive. Was this a maintenance ticket, or did the client call in about their configuration? Filter out all the Proactive Ticket Types and look at how your team is handling the Reactive Tickets, or vice versa.
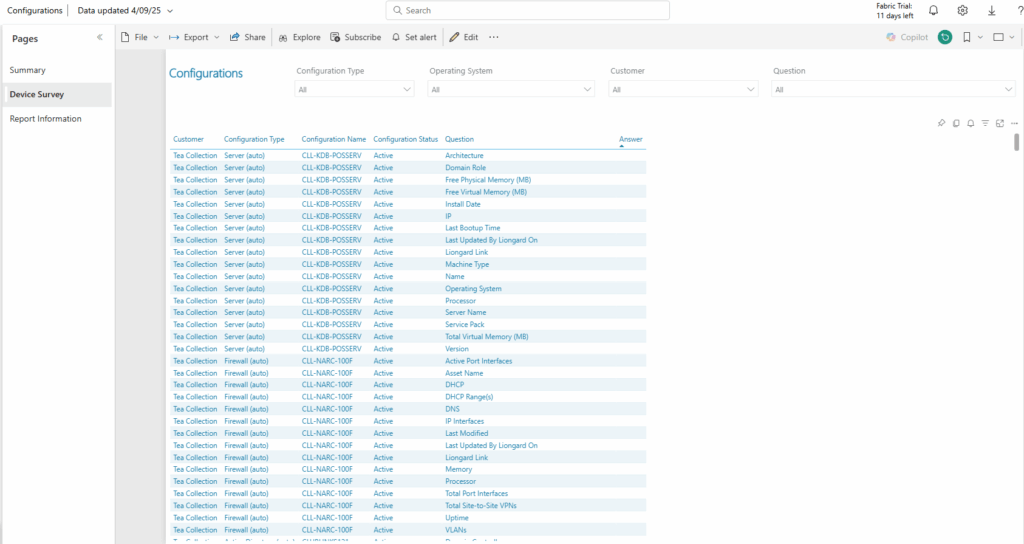
Device Survey in Configurations Report 📋
We’ve updated the Device Survey in Configurations report:
Configurations Report | Device Survey page, added Question and Answer
Questions and Answers from the Configuration Survey are now pulled in, making this report a whole lot more useful… as long as your linked documentation is up-to-date. See all the details on an individual machine’s configuration, right here in Cognition360.
If you’re not familiar with this report, it’s an add-on available on request, and not one of our standard reports. The Configurations report is designed to provide a view of configuration data assigned to tickets so you can see which configuration is generating the most tickets and labor. Have a complete look at our available reports here in our Help Center.
Already a Cognition360 partner? We’d love to hear from you in the Community. Most of these upgrades were inspired by partner input, so your voice makes a real impact. Share your challenges and goals; our team is here to help you overcome said challenges and reach those business goals.
There are a whole lotta updated reports and data models for Cognition360 – ten of them! Lot to go through, a lot to unpack, and a whole lot that you’re going to want for your organization. No huge changes, but valuable, incremental improvements that add some new capabilities – additional filters, new data / columns / pages, and some data model enhancements too.
Some of these are our best-loved / most popular reports (Agreement Profitability and Technician Efficiency are near the top of our Top 10 for sure) are included here.
We were looking at including a video in here, but I went through these with the wise and powerful Christy Strickland, and we’ve decided it’d be better to dedicate a session for our Cognition360 Learning Lab on this – little more interactive so you can ask your questions. The June edition is already spoken for, so this session will be happening July 23, 2025.
If you’re not already joining us for our Learning Lab, get on this – it’s essentially a C360 peer group led by an expert MSP consultant, well worth your time. Usually it’s the inimitable Christy, but sometimes someone imitates her.
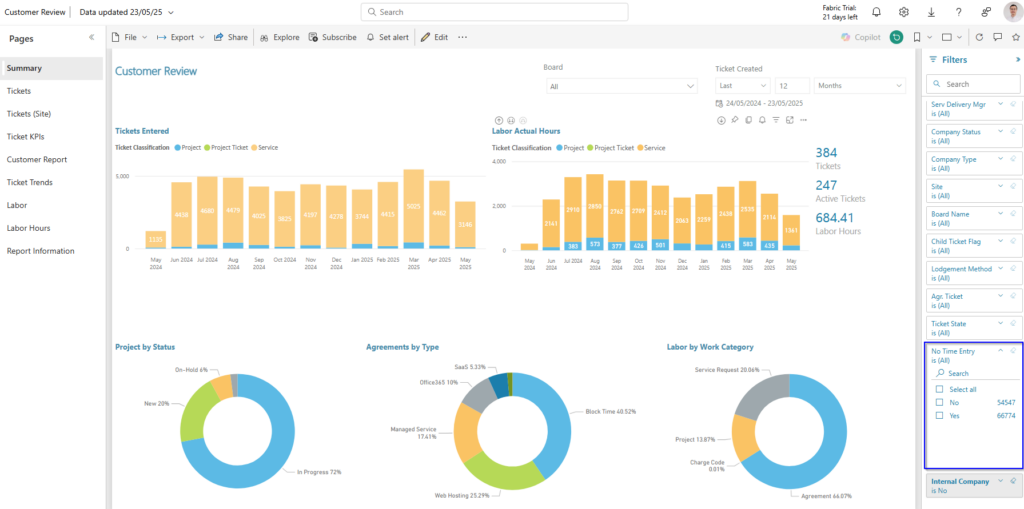
Added a "No Time Entry" filter to Customer Review report.
Customer Review | Summary page, No Time Entry filter added
As the name of this added filter suggests, the No Time Entry filter makes it easy to stop tickets with no time entries from displaying in the report – alert tickets that close, for example.
Or dig into the data in reverse, and examine all tickets that had no time, and get into why – is the team missing adding time entries that should be there?
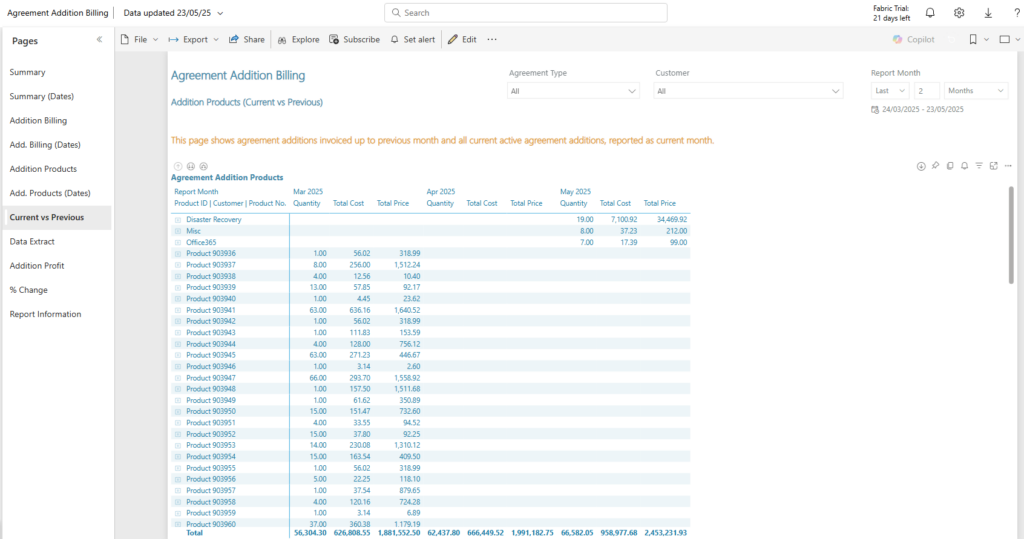
Agreement Addition Billing
Added current month data into Current vs Previous page in the Agreement Addition Billing report.
Agreement Addition Billing Report | Current vs Previous page
The Current vs Previous page was not bringing in current data (non-invoiced amounts), so this is more of a fix; the page was not populating, and now it is. Current vs Previous gives you an idea on what’s been invoiced, and what’s still open so you can check it through to verify accuracy and THEN invoice it out – added or removed users, for example.
We know some partners had been using a client-by-client or month-over-month after invoicing check. This report page provides a better workflow.
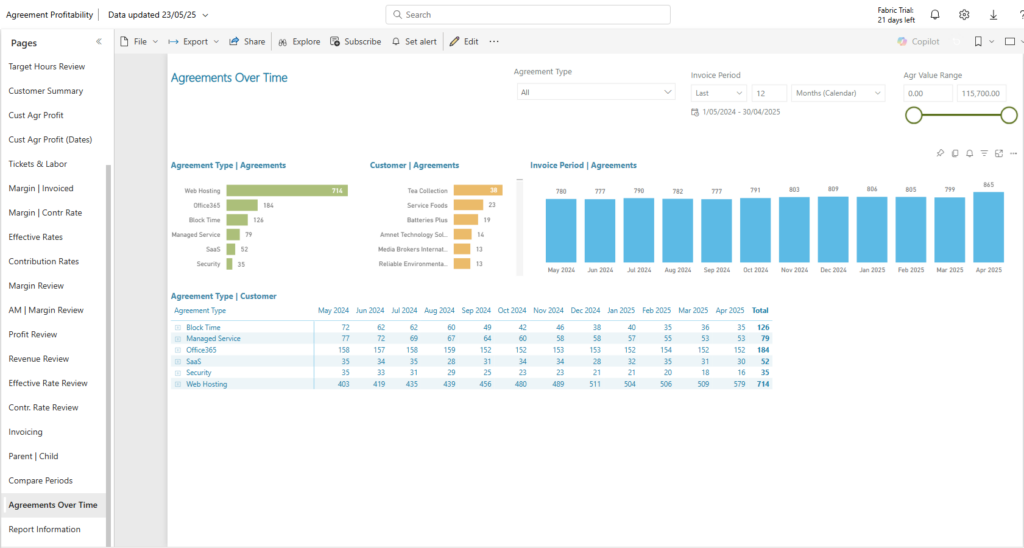
Agreement Profitability
Added a new Agreements Over Time page which shows the change in agreement count over time to the Agreement Profitability report.
Agreement Profitability report | Agreements Over Time page
Trending is here! This allows you to see at a glance how many agreements you started and ended the month with, and view these in different categories. Looking at these by Agreement Types is where you can see where you’re growing, flat, or contracting.
In this screenshot example, Web Hosting had a jump in April, whereas Office365 has been flat over the past year… and things aren’t looking too hot for Security. Because security is standard, right? Shouldn’t have it separate anyway.
Sales Dashboard
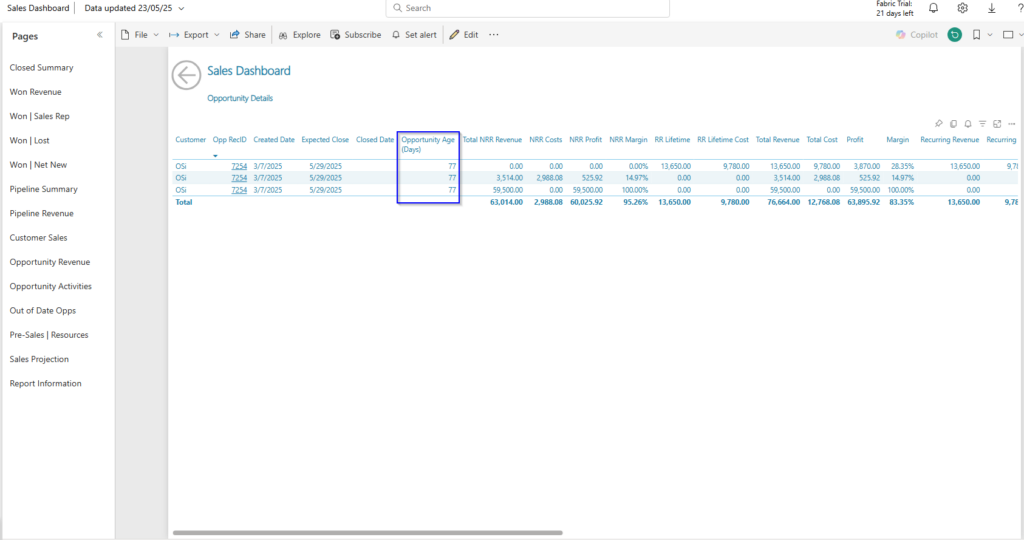
Added Opportunity Age in days to Sales Dashboard.
Sales Dashboard with Opportunity Age (Days) highlighted
This one is super useful – your MSP’s sales manager and leadership will want to see how long opportunities are taking to go from Created to Closed status.
The only way to do this previously was to get data from the Sales Dashboard (looking at the closed date) and the Opportunity Dashboard, and calculating the delta. Now you can see your sales cycle length at a glance.
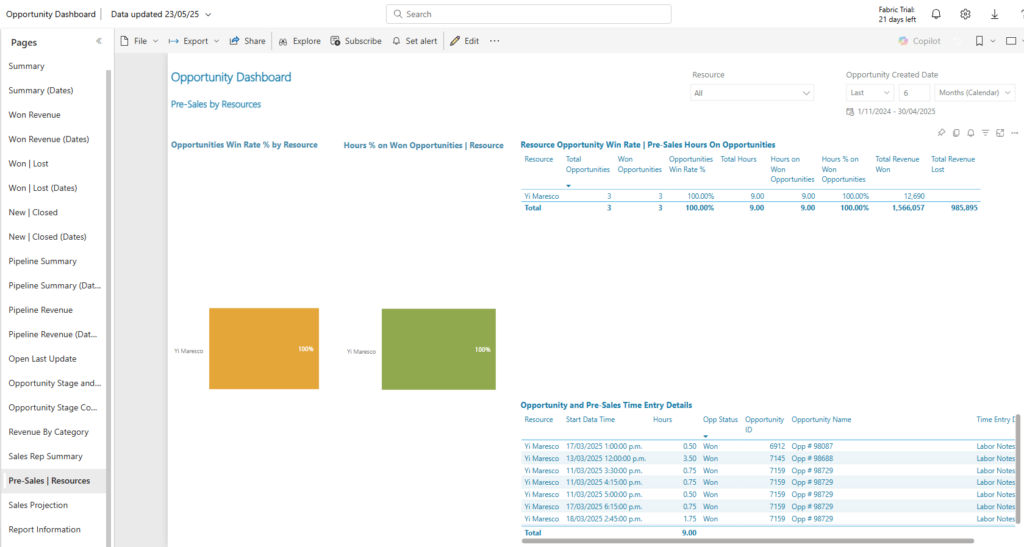
Opportunity Dashboard | new Pre-Sales | Resources page
Pre-Sales | Resources reports on time recorded from (Work Type="Pre-Sales" Activities) time entries applied to Opportunities. The purpose is to show the impact on Opportunity Win Rate from the pre-sales time spent on the opportunity – it’s a measure of sales win efficiency. Like many reports, this is predicated on entering time accurately, which might require a change for your sales team if this isn’t typically part of their process.
From a managerial standpoint, it’s probably most useful for looking at over the long term, depending on your typical sales cycle length, but it could be handy to find outliers (huge deals that close with minimal resources, or not-so-amazing deals that required too much effort) or give you another data point if you’re managing a large sales or account management team.
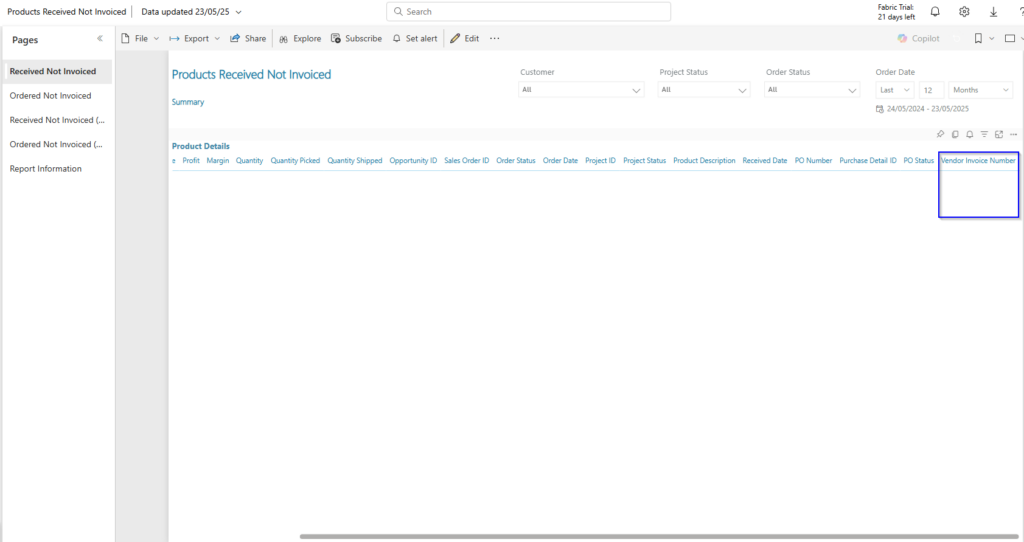
Products Received Not Invoiced
Added Vendor Invoice Number to the add-on Products Received Not Invoiced report
Heavily-redacted Products Received Not Invoiced | Summary page, new “Vendor Invoice Number” column
The data here is all redacted, but the Vendor Invoice Number will pull from purchase order information, allowing you to to reconcile products received that you’ve yet to invoice against the vendor invoices.
Not familiar at all with this report? It’s in our Add-On Workspace. Might take a little extra time to get it deployed for you if you would like to add it and don’t have it already, as there is some additional data that will need to be loaded.
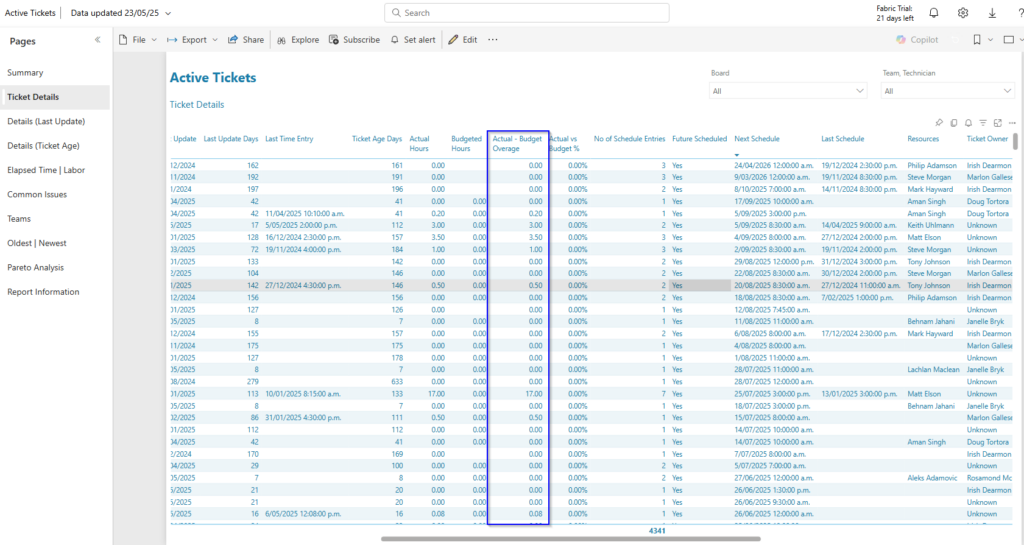
Active Tickets
Added Actual vs Budget Overage to the Active Tickets report’s Ticket Details page.
Active Tickets report | Ticket Details page, new “Actual - Budget Overage” column
The Actual - Budget Overage column data shows how many actual hours a technician worked on specific active tickets over the pre-determined budgeted hours.
If there’s a budget assigned to a ticket, you can sort / filter to see active tickets way over budget. This could be useful for ticket escalations, or reconciling when things are off track and conversations need to be had with your client, your team, or both. Another useful tool for managerial control on service delivery.
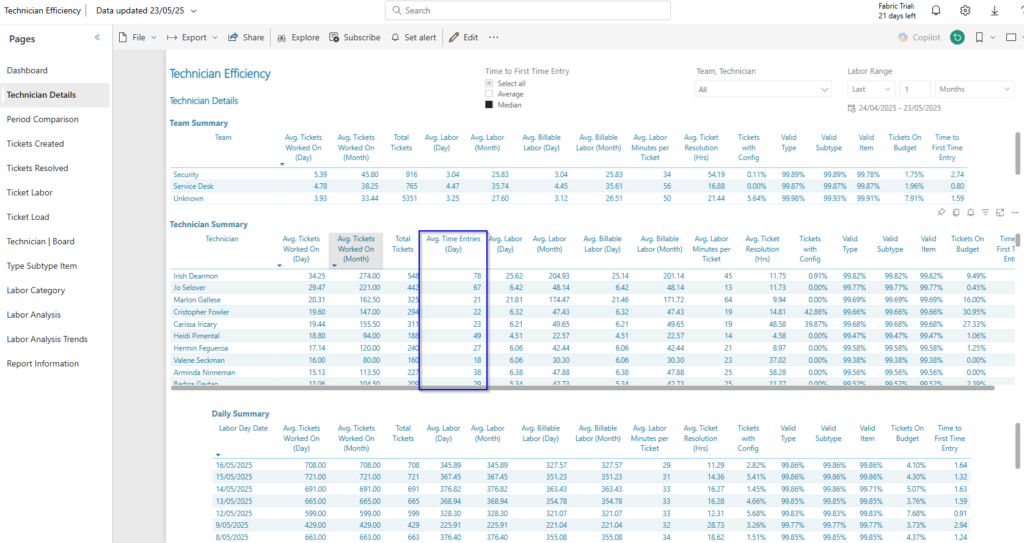
Technician Efficiency
Added an "Avg. Time Entries (Day)" column to the Technician Efficiency report’s Technician Details page.
Technician Efficiency report | Technician Details page highlighting new Avg. Time Entries (Day) column
There wasn’t a Day column here before; one was only able to view the average per week or per month. This is one of those managerial measures your team will either love or hate, but it’ll give you an accurate measure of who’s putting in the most time entries on average each day, and that can be a necessary evil.
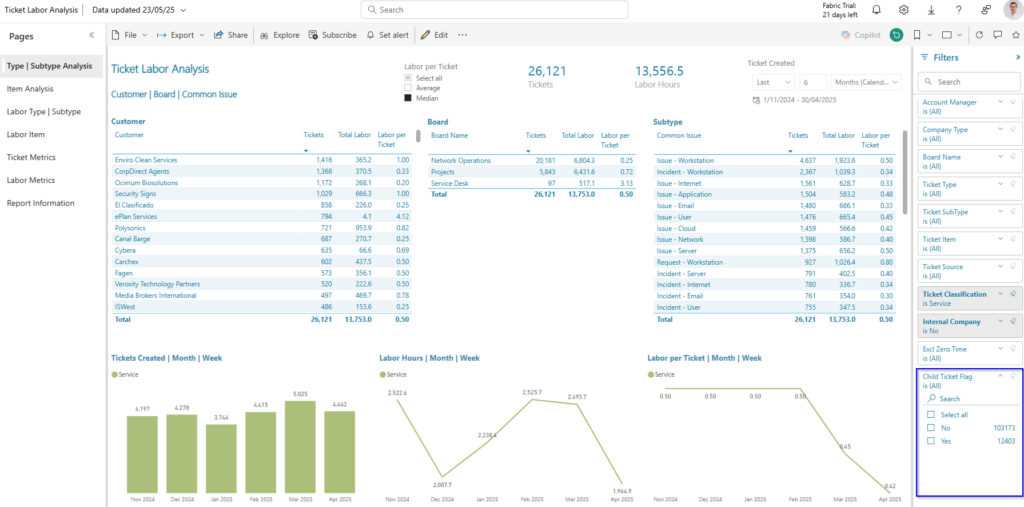
Ticket Labor Analysis
A Child Ticket Flag has been added as an all page filter to the Ticket Labor Analysis report.
Ticket Labor Analysis Report | Type | Subtype Analysis page – Child Ticket Flag filter highlighted
Suppose you had a large / common incident – an ISP connection or server goes down, and you’re inundated with tickets. You create a main ticket for the incident, and bundle the rest as child tickets. The new Child Ticket Flag filter allows users to include or exclude these child tickets from common issue reporting.
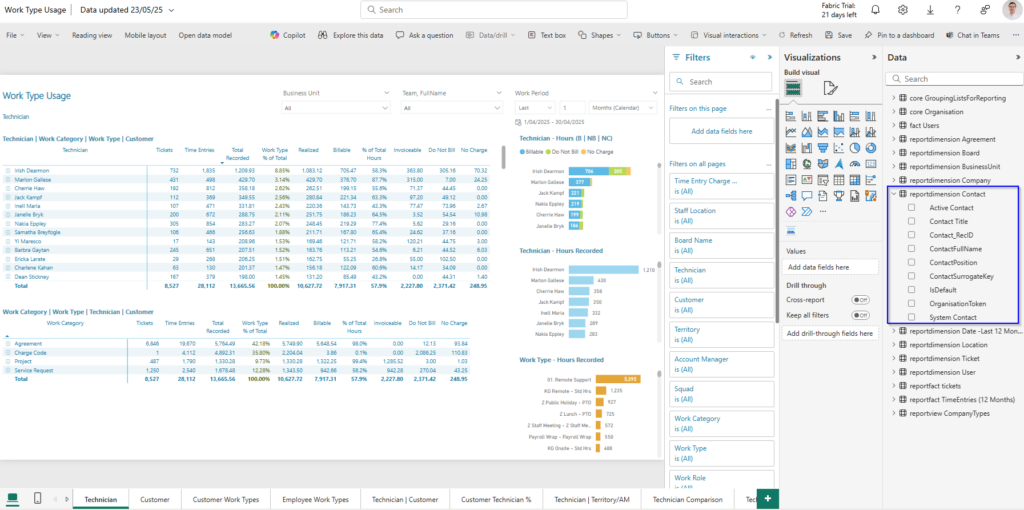
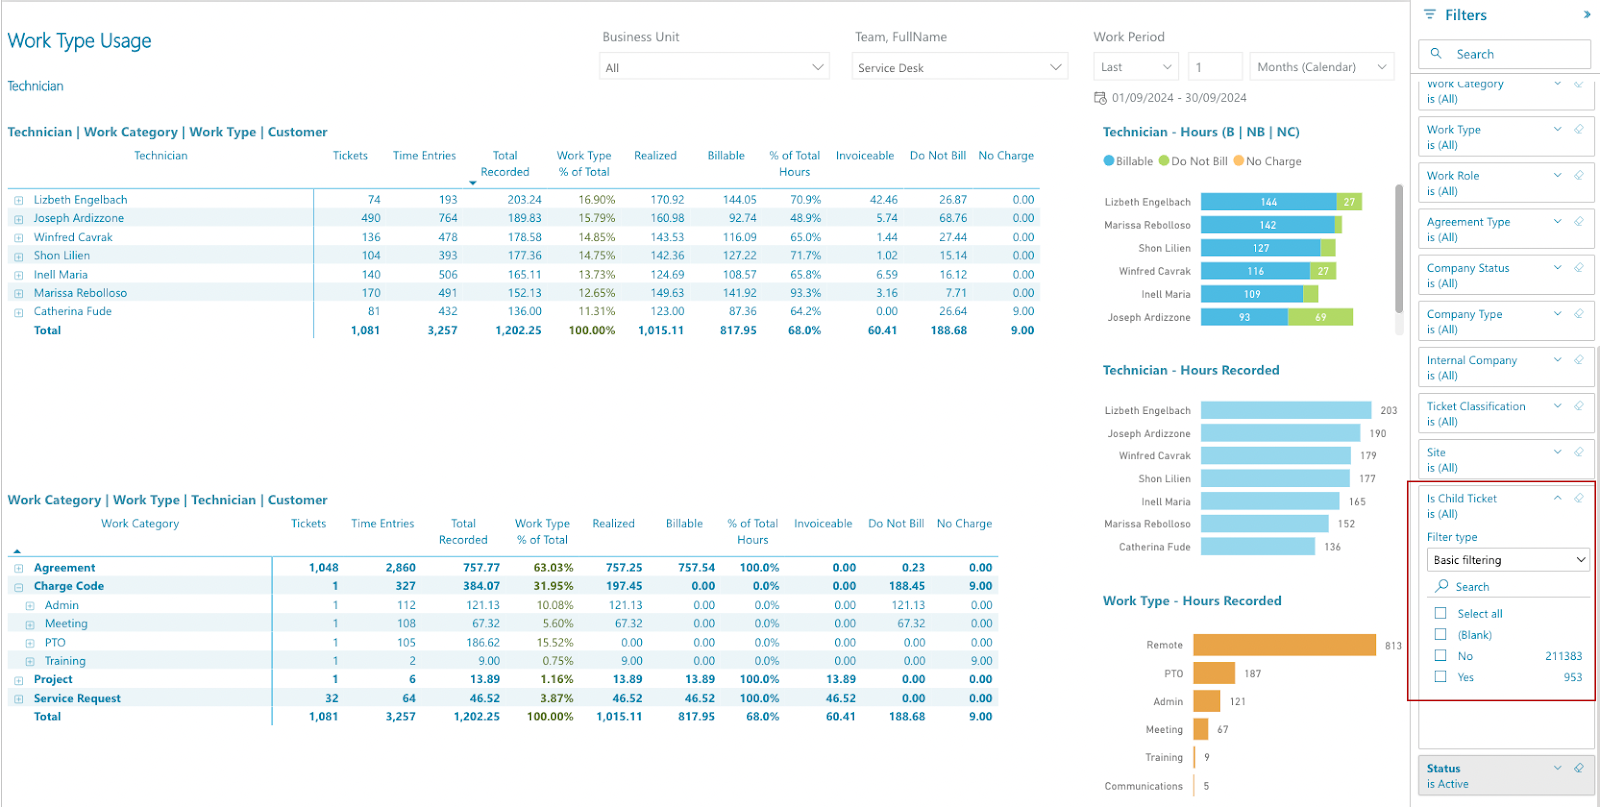
Work Type Usage
Added Ticket Contact Details information to the Work Type Usage Report data model.
Work Type Usage data model update
Visually, not much to show here, but we’re making it easy to filter to get contact details associated with the ticket. If you’ve had a client who’s submitted 50 tickets in short order, this will get you into who is submitting them when looking at the work types reported by your tech team.
If you’re already a Cognition360 partner, leave us a comment here on our Community site – always love to get feedback. Most of these updates came from support requests, solving problems for partners who requested them. Don’t hesitate to leave us your feedback or let us know what your business needs are; we’re here to assist you and help grow your business.
Spring is a time of growth and renewal, and the Cognition360 team has sprung into action release enhancements to four reports for Cognition360, providing your MSP with improved analysis of your operations and financial situation. Because we don’t just roll out updates willy-nilly, you have to ask for the reports to get them. A quick form fill and our Support team will have them in place for you.
Let’s jump in and take a quick look at each to see exactly what’s been enhanced.
Which four reports have been updated?
Here’s the spring list 🌸:
Agreement Profitability
Invoice Payments
Tickets KPI
Ticket SLA Insights (report hasn’t changed; data model update only)
Agreement Profitability is where most of our partners start with Cognition360, and the others are key core reports as well.
Let’s dig into what’s new with each of these four improved reports.
How does one access these updated reports?
The Cognition360 Support team kindly set up a request form (thanks again Marnel for setting this up so quick), as we’ve found it worked well the last couple updates we did. Please fill in this form and request the reports you want to have updated to the latest version. 🧨💥and you’re in and using them.
What’s new-and-or-improved in each of these four reports?
We’ll go through the four of these in detail below.
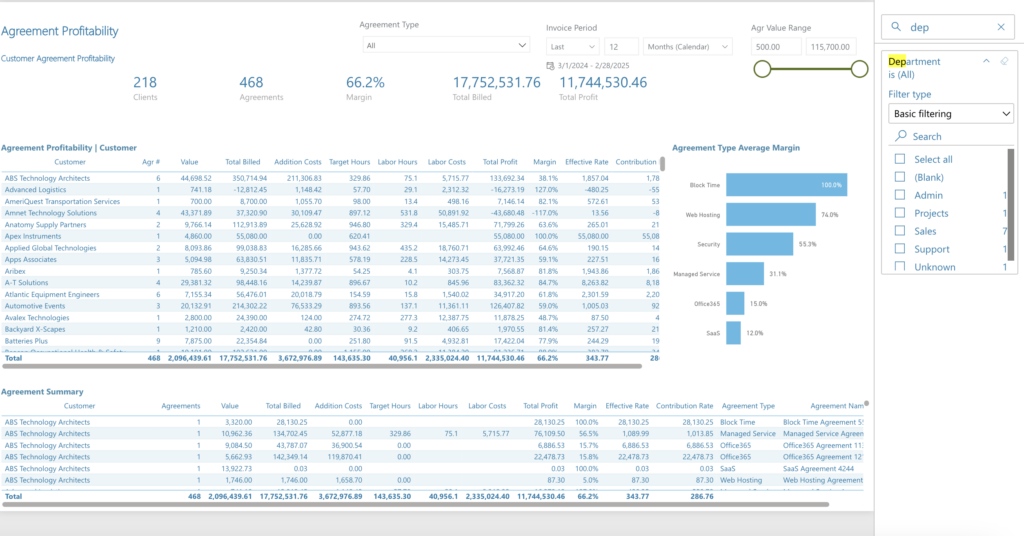
There’s no way to tell how individual departments are performing from an Agreement profit perspective… until now!
Agreement Profitability | Customer Agreement Profitability page – new Agreement Department filter
Adding a Department filter lets you get more granular with Agreement Profitability. Now you can get a more detailed look at exactly which departments may be under or over-performing. Depending on how you have your PSA set up and how you organize your MSP, this could be useful information for managerial decision making.
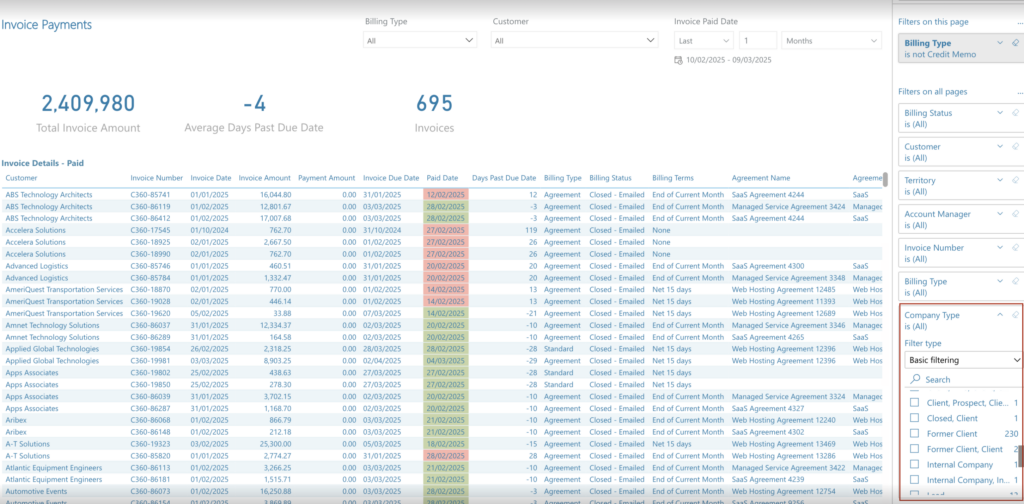
Invoice Payments Report
Cash flow is the lifeblood of every business, and we have a new filter that can help you identify potential cash flow challenges based on company type. We’ve added a Company Type filter to Invoice Payments report to filter Invoice and Payments by Company Type.
Invoice Payments Report | Invoices Paid page – new Company Type filter
If you have a lot of clients concentrated in particular industries, having a way to identify a potential issue with payment on your invoices based on what type of companies they are gives you very useful data that will let you take action. This new Company Type filter will make it easier for you to find Invoices for Customers that have a specific Company Type in use in just a few clicks.
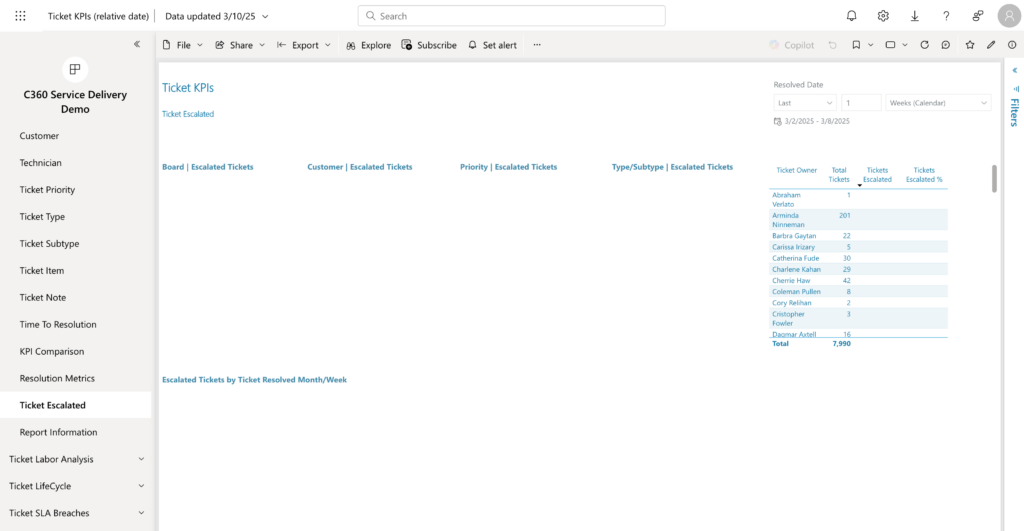
Tickets KPI Report
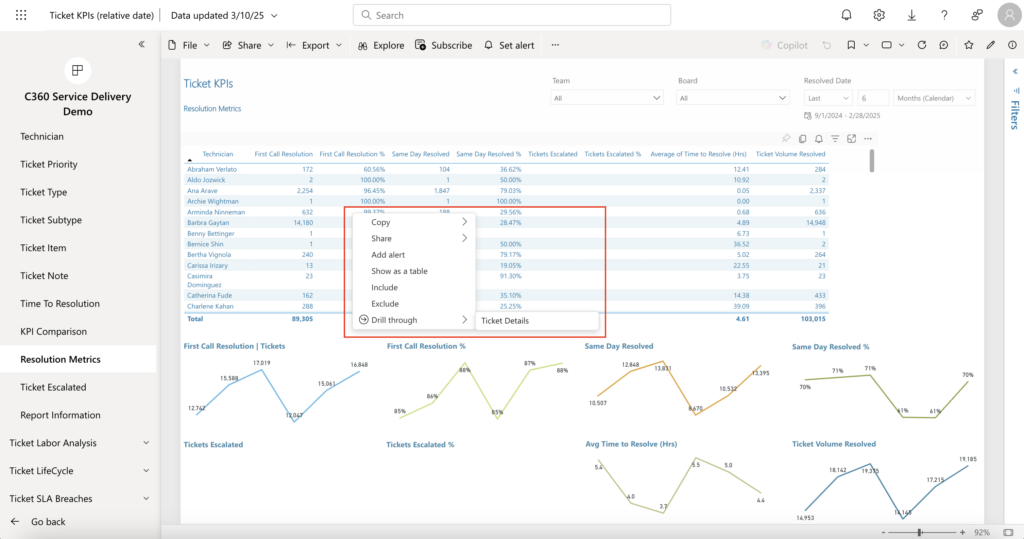
When reviewing ticket resolution metrics, it’s difficult to tell which tickets contributed to a client being either under or over-served from a ticket resolution point of view. It’s also a challenge to see which specific tickets were escalated and who the impacted customer was. We’ve added a new view and a new page to our Tickets KPI report to address these needs.
Tickets KPIs Report | Resolution Metric page – new drill-through functionality to the Ticket Details page
In the Ticket KPIs report, we added the drill-through functionality from the Resolution Metric page. This allows users to drill through to the Ticket Details page to check detailed ticket information. Should a particular ticket have been escalated –is your team following SOPs correctly, should you provide more training to lower-level techs to address those kinds of tickets, or is there “VIP” treatment going on that doesn’t align with your SLA? Get into the reasons why a ticket has been escalated, which allows you to make better decisions.
Tickets KPIs Report | new Ticket Escalated page – see Escalated Tickets by Board and Customer
A new Ticket Escalated page shows Escalated Tickets by Board and Customer. The drill-through functionality is great at a detail level; this page gives you the bigger picture to find common issues. Note: There is some assembly required for our Support Team to identify what a proper escalation means for your organization. If you’d like to track your escalations please send us a Support Request with your Escalation Process step-by-step so we can configure the report appropriately.
Ticket SLA Insight Reports
Nothing specific to show here, but if you’d like Billable Hours added (for custom reporting, for example), we’re able to surface this in an updated data model.
We just released enhancements to four reports for Cognition360, providing your MSP with improved analysis of your operations and financial situation. Four reports for our fourth and final release of 2024 for Cognition360, and just like the previous releases, you have to ask for the reports to get them.
Let’s take a quick look at each and see exactly what’s new and improved.
Which four reports have been enhanced?
Here’s the list:
Technology Business Review
Project Summary Report
Team Utilization Report
Work Type Usage
Team Utilization is one of our most popular and important reports, and the other three are valuable core reports as well.
Also, there are no references to 90s pop music or films anywhere in this update. Think that was leaned into a little too hard last time around, so we’ll keep it on topic this time. No more 1992 references. At least, not many. Maybe just A Few Good Men references.
How does one access these updated reports?
The Cognition360 Support team kindly set up a request form (shout out to Marnel for setting this up in literally minutes!), as we’ve found it worked well the last couple updates we did. Please fill in this form and request the reports you want to have updated to the latest version. 💥, next thing you know you’re in and using them.
What’s new-and-or-improved in each of these four reports?
Our running joke is that “these improvements will improve customer retention, enhance your quality of life, and empower you to make more informed and strategic business decisions.” But you know what? In every joke, there’s a grain of truth, and in this case, more than just a grain – the enhancements will help you make more informed decisions for your MSP. We’ll go through the four of these in detail below.
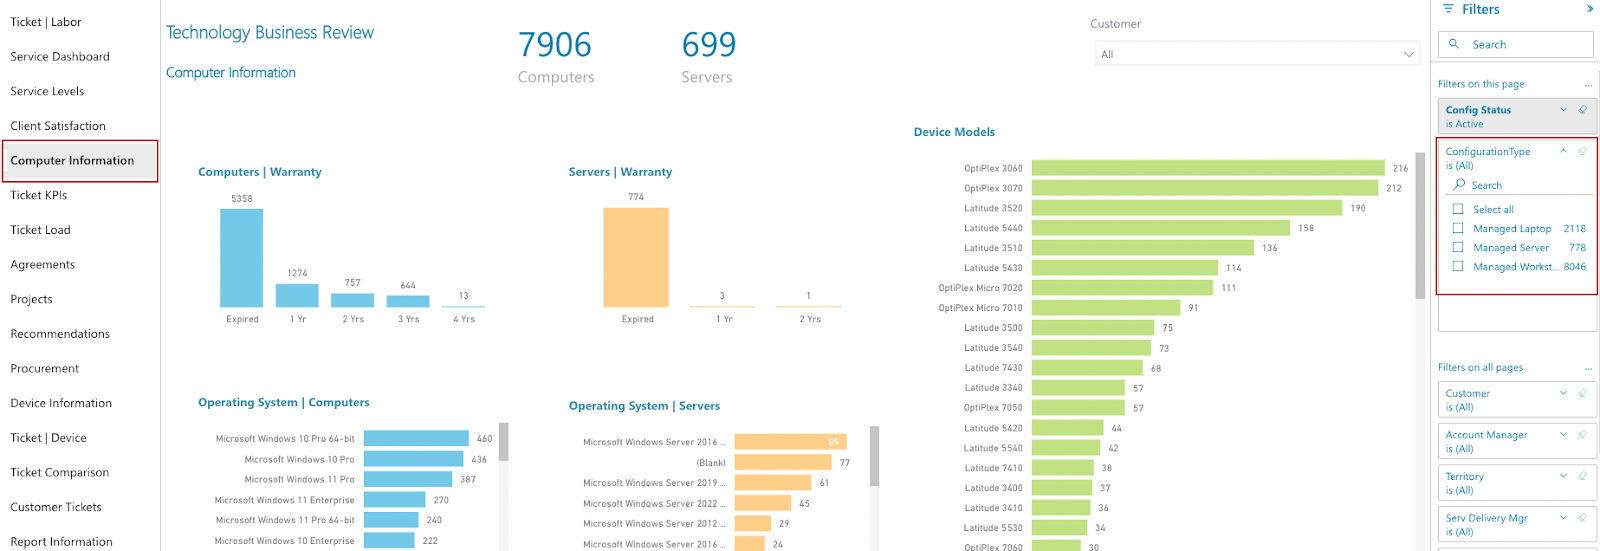
We’ve added a new Configuration Type filter to the Computer Information page inside the Technology Business Review.
Technology Business Review | Computer Information – new Configuration Type filter
The added Configuration Type filter allows you to quickly filter device data, helping you understand which devices warrant additional attention and discussion with clients during a business review conversation. Lifecycle Manager also helps identify opportunities and provides you with a workflow to renew warranties or replace end-of-life devices, and you should definitely check it out if you haven’t already.
There may be problem (or opportunity) areas within specific Configuration Types, and this gives you a way to identify those. You likely already have a plan in place for your MSP to capitalize on opportunities with Windows 10 going EOL in October next year, but here’s a way to identify potential problematic hardware and encourage clients to budget for replacements.
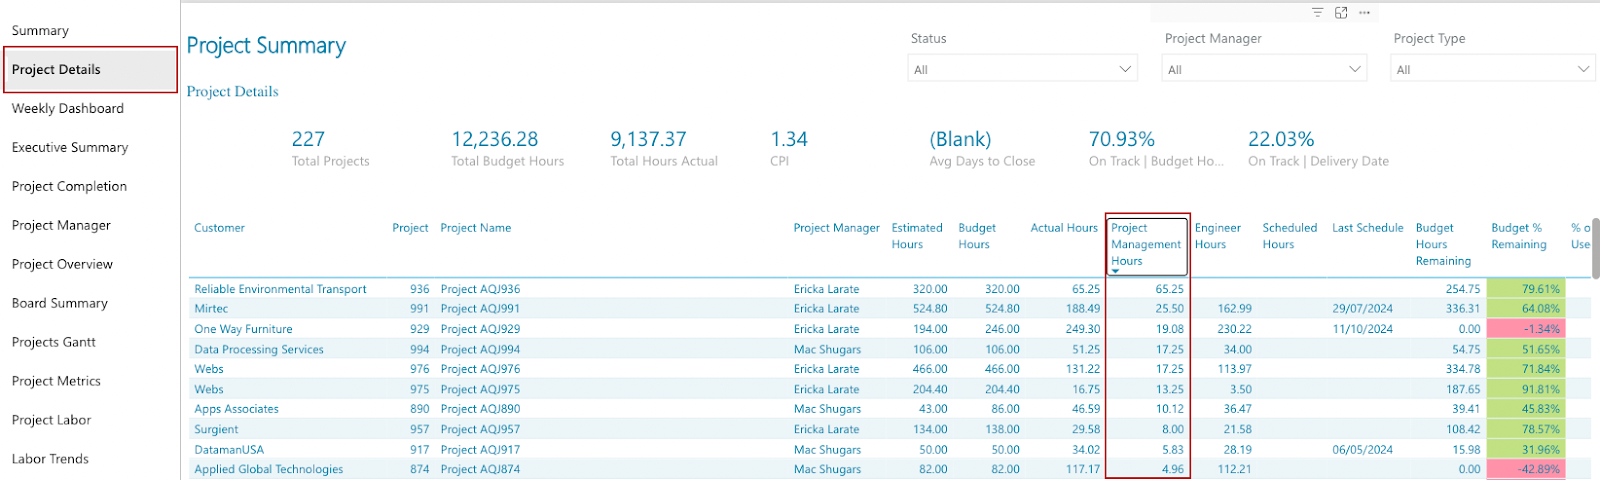
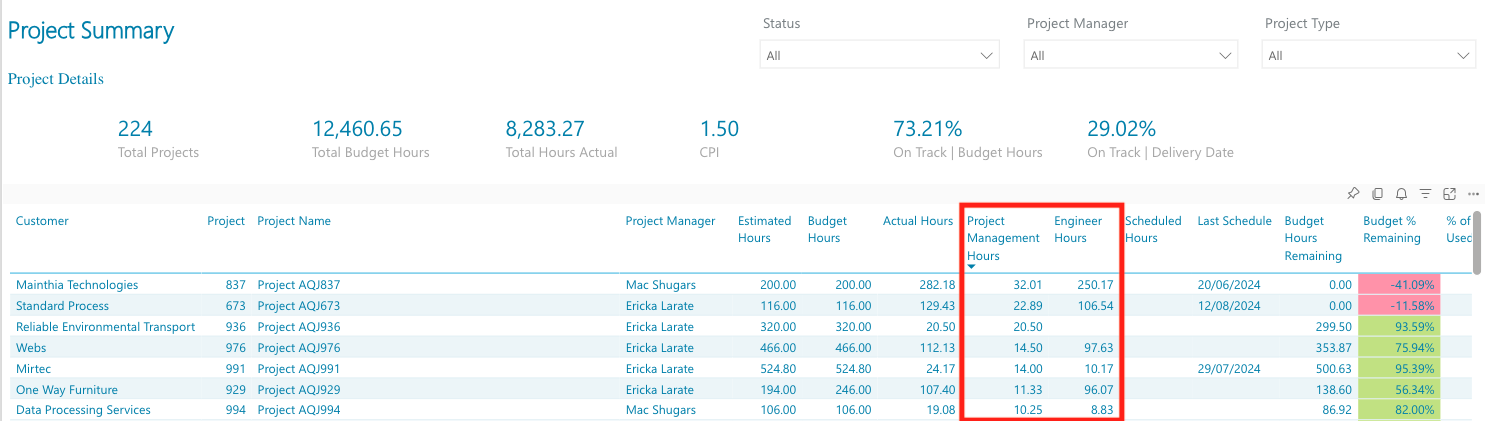
Project Summary Report
Project Management Hours are now added to the Project Details Report under the Project Summary in Project Details as a separate column.
It wasn’t straightforward to compare actual project spend vs the budget, schedule, and estimated hours, and project management overhead hours are a necessary evil that need to be tracked and accounted for.
Adding this additional column of data will allow users to understand how many hours a technician spends as a project manager. Ultimately, you need to account for these hours when planning and quoting future projects, so this will provide a useful actual measure on project management overhead for current and past projects. It can be easy to forget about or underestimate management hours when calculating margin at the outset, so we wanted to make this clearer right in the high-level Project Details.
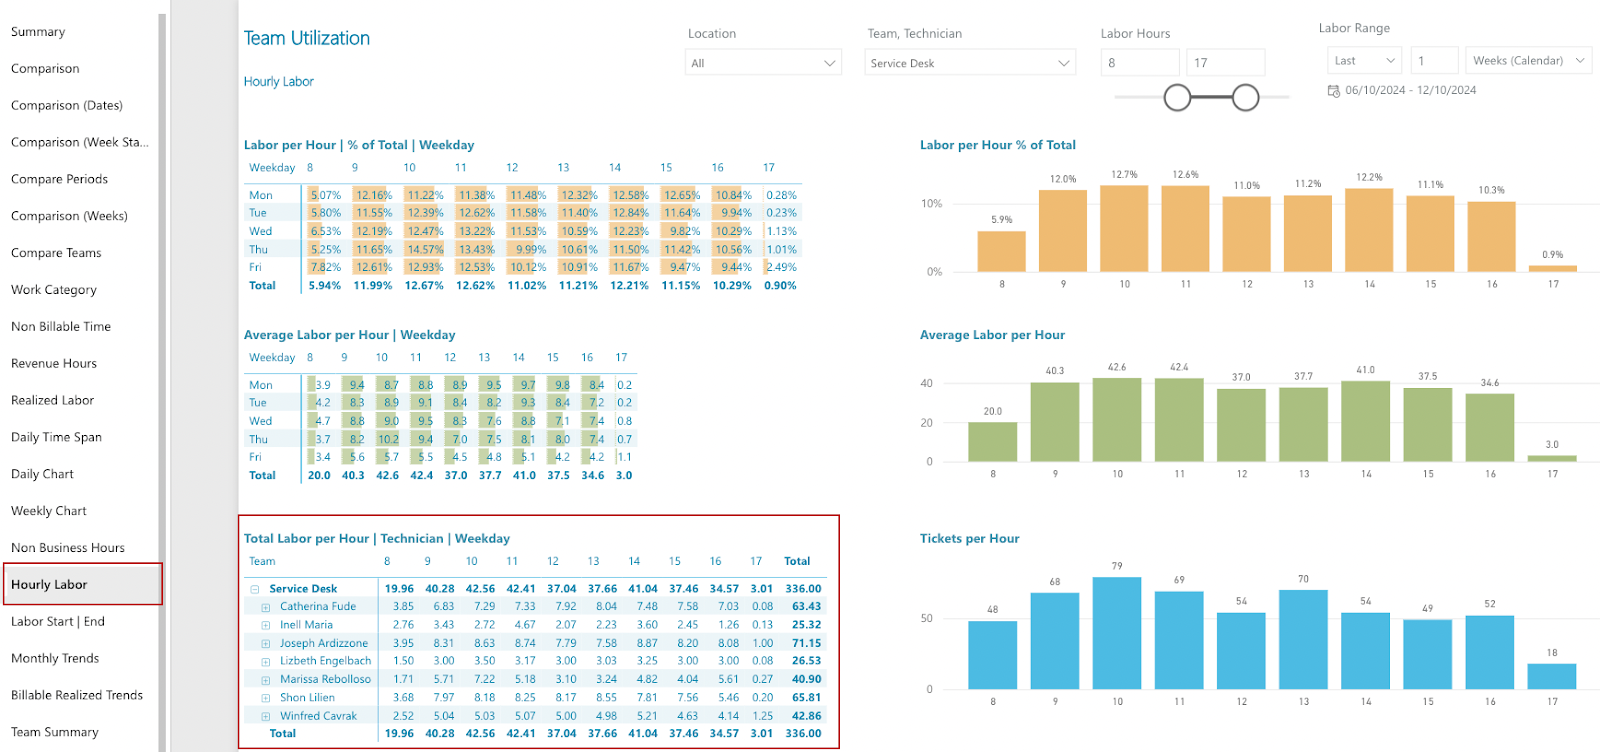
Team Utilization Report
A drill-through to the Total Labor per Hour has now been added to the Hourly Labor page in the Team Utilization Report, showing labor per hour by technician.
Team Utilization Report | Hourly Labor – new drill-through to Hourly Labor data
This drill-down view lets you see your entire tech team, and how many hours they’re utilized. In the example above, we’ve set the Labor Hours to the time from 08:00 to 17:00, and Joseph, Shon, and Catherina are the highest utilized over the last week.
Work Type Usage
A yes/no filter for Child Tickets has been added to the Customer page of the Work Type Usage Report.
Work Type Usage Report | Customer – new Child Ticket filter
The addition of this filter allows you to toggle child tickets off or on when viewing / reviewing your technicians’ work by work type. Some service desk teams make extensive use of child tickets as part of their workflows, but feel these shouldn’t necessarily “count” as they weren’t created by client users. Other times (on projects, for example), including child tickets may be desirable. The addition of this filter gives your team another option on viewing information.
Winter is Coming
Winter has very much arrived here in Canada, and our American friends have celebrated Thanksgiving now, so as mentioned at the top, these are the last updated reports of the year. Please use the form to request any of these that interest you, and keep an eye out for more enhancements to Cognition360.
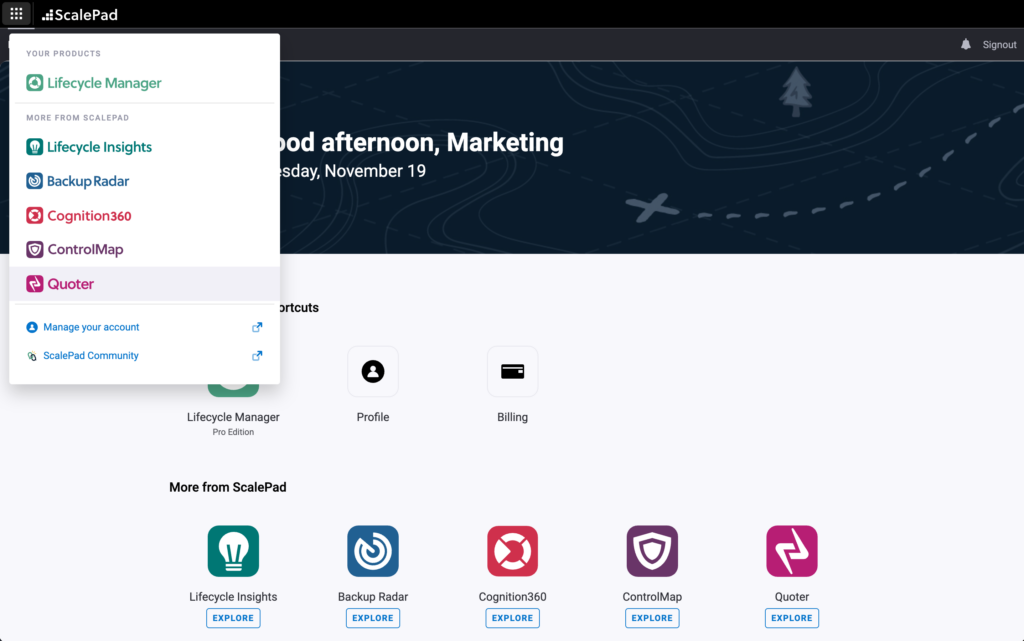
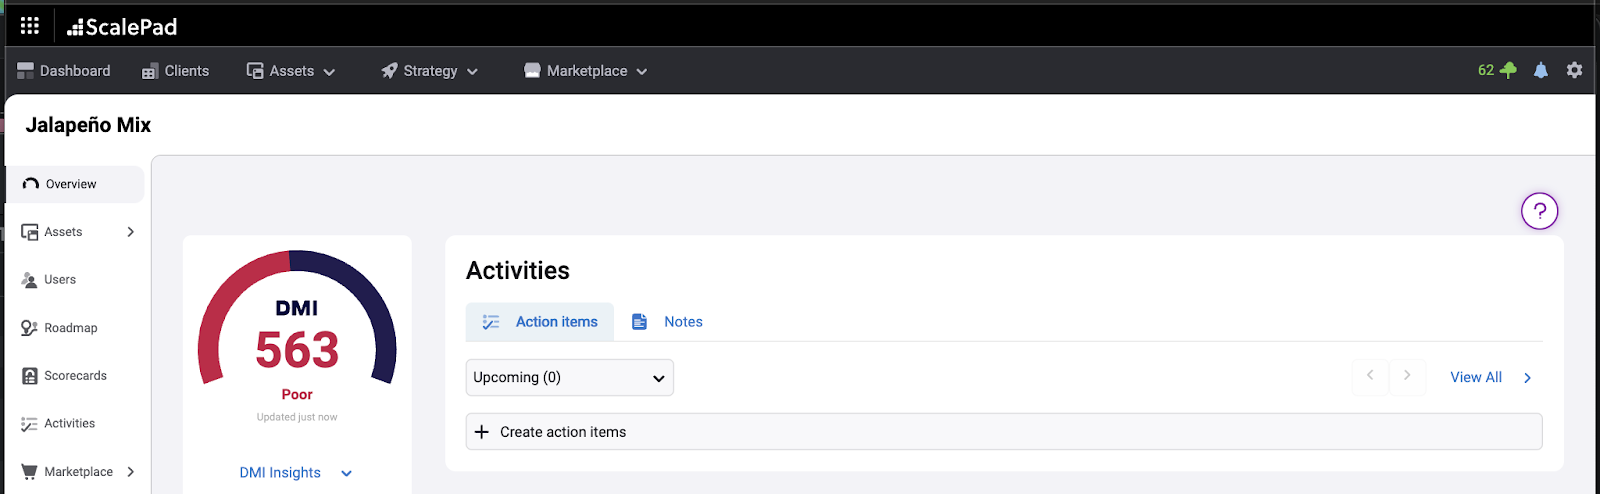
ScalePad has launched the next step towards a unified experience across our product suite - the ScalePad Hub. Now, all ScalePad app users have access to all of their products through a single centralized account, which we’re calling the ScalePad Hub.
What is the ScalePad Hub?
The ScalePad Hub is a centralized portal for all ScalePad apps - it is the entry point into the ScalePad app ecosystem for Partners. It’s the first step in our vision of an integrated product suite that allows seamless flow of crucial data & information between our apps.
We strive to provide our Partners with the most advanced automation so they can spend less time cobbling together data and more time on high-value work that supports their clients. The ScalePad Hub is a stepping stone into tighter app integrations, expanded automation, and an enhanced experience for all of our Partners - something we’re calling the ScalePad OS. We have lots more in store (read more at the bottom of this update) and the ScalePad Hub is the foundational first step.
What can I do in the ScalePad Hub?
The Hub grants ScalePad Partners the following:
Centralized App Access
User Management
Subscription Management
Centralized App Access
Partners with subscriptions to multiple ScalePad applications can now quickly navigate between apps without the need to sign in to separate app-specific portals. Users will only have to sign in to the ScalePad Hub once to have access to all of their apps from their account by centralizing the access point for all the apps, Partners no longer have to store multiple app-specific credentials or bookmark several sign in pages - every ScalePad app can be accessed from a single screen (or pane of glass for those who prefer the term… we know it’s polarizing).
From within any ScalePad account, users can seamlessly navigate to their other subscriptions. Partners only need to click the Bento Box menu in the top nav to quickly open any of their other subscribed apps. A centralized sign in streamlines app switching as there is no longer the need to enter another set of credentials from another sign in page.
User Management
The ScalePad Hub is the portal for adding new users and granting them permission to access the apps necessary for their role and responsibilities. Admins are able to manage their ScalePad app users from one place, easily update their entitlements, and enforce security settings for MFA and SSO. Individual users can update their profile details, password, and MFA settings all in the ScalePad Hub.
Note that access permissions to specific features in each app are still configured in each app. The ScalePad Hub simply adds (or removes) users to each Partners ScalePad account. The individual app-based permissions are still managed in each app. For more details, visit our new ScalePad Hub help center.
Subscription Management
Within the ScalePad Hub, Partners are able to manage their ScalePad app subscriptions and entitlements. On the Billing tab, you will be able to view details of your current ScalePad subscription, manage your plans, and even add new ScalePad apps into your stack.
Where do I find the ScalePad Hub?
The URL for the ScalePad Hub is app.scalepad.com. As of November 20, 2024, all users signing into their ScalePad apps will be automatically redirected to app.scalepad.com for sign in.
From within your ScalePad apps, clicking on the ScalePad icon in the top nav bar will take you back to the Hub.
I still have questions…
We have answers! Visit this FAQ to find the answer to all your questions about the ScalePad Hub. You can also find more detailed information in our new ScalePad help center or get in touch with our team at [email protected].
What’s next for ScalePad?
The launch of the ScalePad Hub sets the stage for unifed billing. Over the next few weeks, we’ll be migrating to a centralized billing system so Partners can manage all of their app subscriptions in one place. Keep an eye out for in-app messages as we migrate each apps billing to the ScalePad Hub.
At the ScalePad Innovate event in June, we outlined our vision for the ScalePad platform - a deeply integrated suite of apps that helps MSPs truly grow while providing the highest level of service to their clients. The Hub is just the first step towards achieving this vision.
We’ll continue working on the rest of the ScalePad vision, which includes developing the ScalePad OS to unify integrations in the Hub instead of each separate app. This is a critical piece of our platform that will connect your tech stack to all of our apps internally to allow free flow of information to eliminate information silos. Keep an eye on our updates page for more exciting releases as we continue rolling out enhancements to our product suite.
ScalePad will be hosting our next All Partners Conference, Ignition, on January 23. Join us as we bring insight into the key trends, challenges, and opportunities for MSPs. We’ll also be giving a peek into our 2025 product roadmap. Register here to save your seat for this virtual event.
TL;DR: What’s New For Cognition360?
Cognition360 has released enhancements to five reports that provide your MSP with improved analysis of your operations and financial measures, including four of our core reports. Just like the set of several reports we updated in March, and the four more we updated in July, however, you have to ask for them to get them.
Let’s take a quick look at each of the new-and-improved reports and see exactly what’s new and improved.
Which five reports exactly?
Here’s the list:
Fixed Fee Tickets Report (add-on)
Ticket Daily Stats Report (core)
Customer Profitability Report (core)
Time Entry Benchmark (core)
Project Summary Report (core)
You might not be using all of these reports now, but they’re all well worth a second look.
How do I gain access to these reports?
The Cognition360 Support team has just what you need. If you know exactly what you want, you can fill in this form and request to have the reports you want updated to the latest version. Next step, you’re in and using them.
What’s new-and-or-improved in each of these five reports?
Once again, the official word from our Product team is that “these improvements will improve customer retention, enhance your quality of life, and empower you to make more informed and strategic business decisions.”
Did you take advantage of the last reports that we updated (by the way, here’s the form if you missed out last time, and a link to read what you missed)? Did they enhance your life’s quality? These ones just might. Read on to learn more… and FYI, the best is saved for last.
“Save The Best For Last” was also a huge hit song in 1992 for actress, pop star, and former Miss America winner Vanessa Williams.
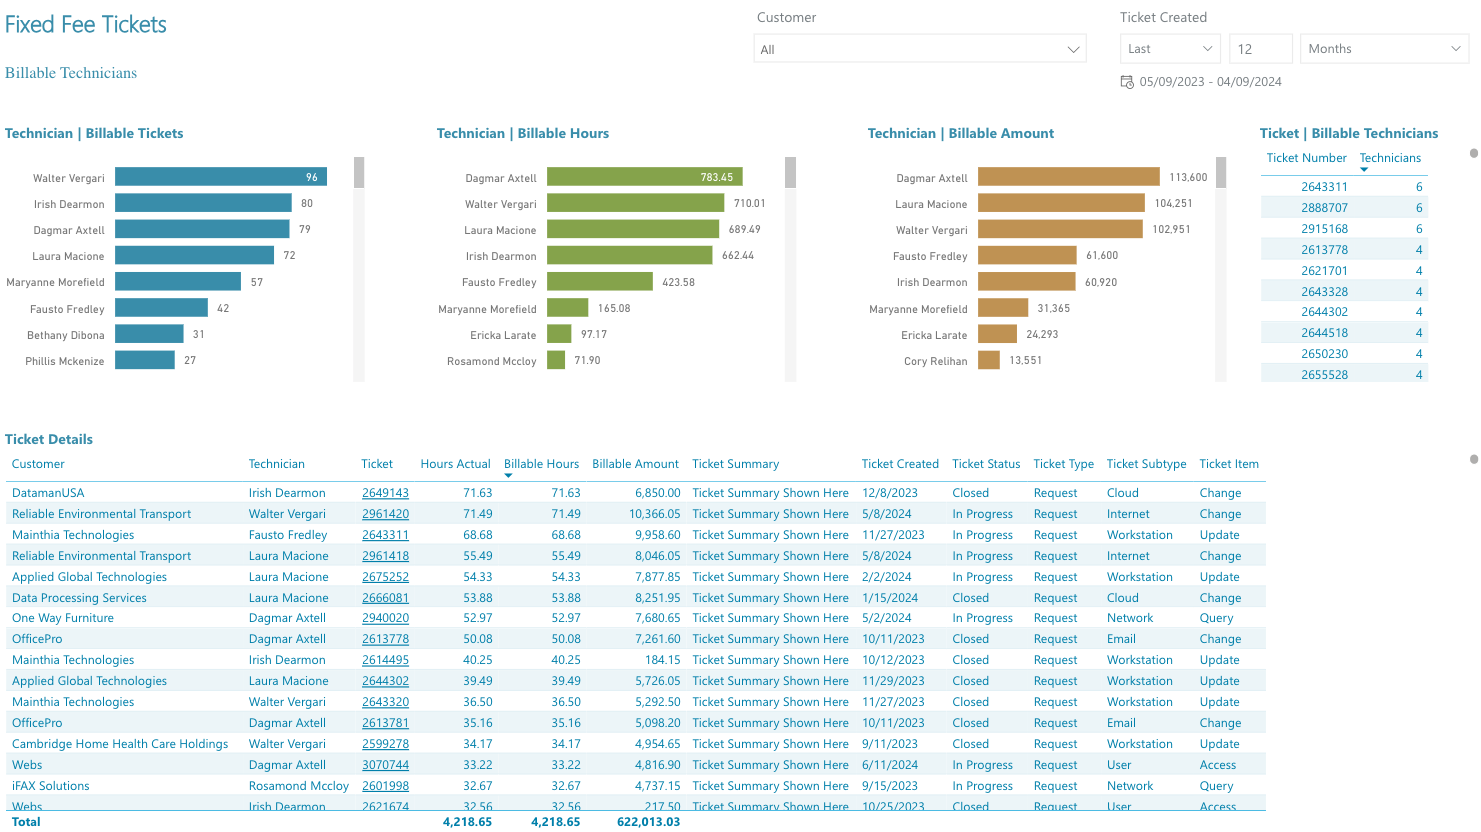
Fixed Fee Tickets Report
Speaking of 1992, do you remember the 1992 Disney film Aladdin, when the titular character sang about “a new fantastic point of view” in the film’s Oscar and Grammy-winning signature song “A Whole New World”? Well, now in 2024, we’ve added a whole new Billable Technicians page that will give you a new fantastic point of view – the technicians who worked on those tickets, including the billable hours and the billable amount.
Fixed Fee Tickets Report – new Billable Technicians page
All the ticket details are linked here, along with bar charts for the number of billable tickets per technician, the billable hours per technician for these tickets, and the associated billable amounts.
You can also see in the table on the top right how many techs worked on bigger tickets, and this can help you find oddities… like our example, where 6 techs worked on a fixed-fee workstation update for 68.68 billable hours and billed nearly $10,000. Hopefully you don’t find alarming examples in your own business… feels like the client relationship could be in “A Whole New World” of pain.
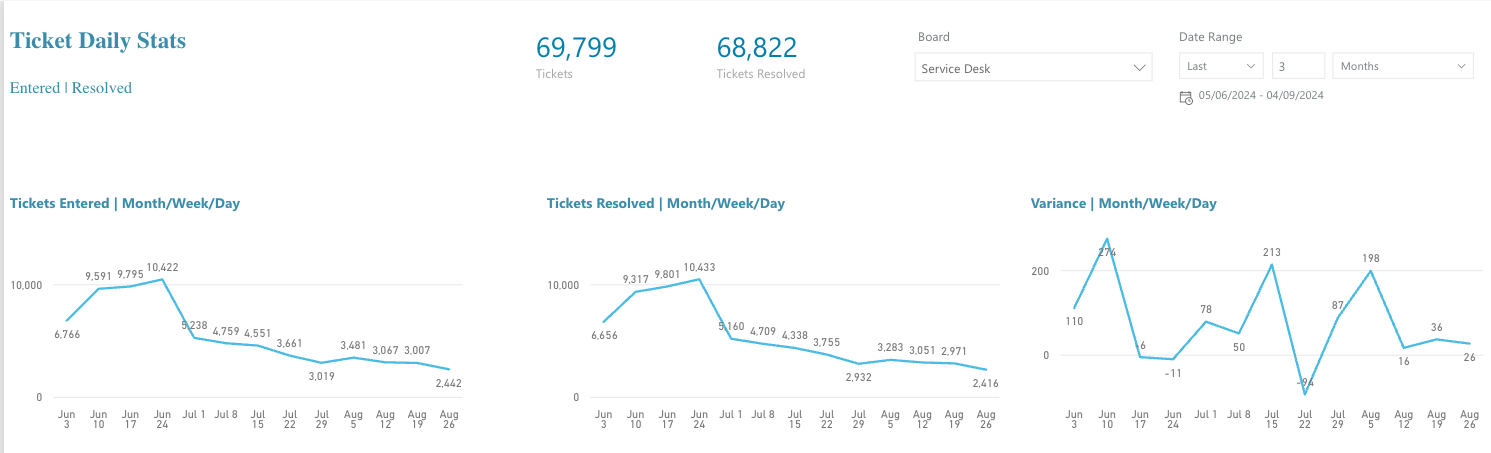
Tickets Daily Stats Report
This is just a quick clean-up to the Entered | Resolved page:
The Entered | Resolved page will now show tickets entered vs tickets resolved on the same date range selected for an easier visual comparison. Strongly recommend getting this fix as it makes the page much more useful.
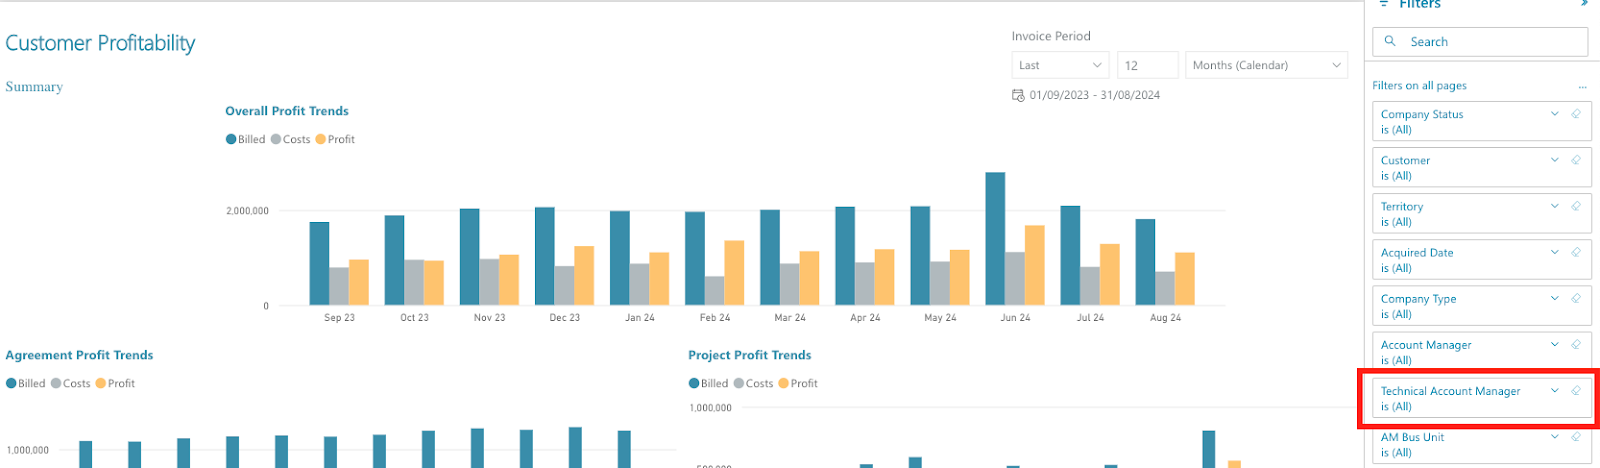
Customer Profitability Report
The Customer Profitability Report has been updated with a new filter for Technical Account Manager added:
Customer Profitability Report – new Technical Account Manager filter
Technical Account Manager has been added as a filter just below Account Manager on the Summary page of the Customer Profitability Report. If your organization has both AMs and TAMs, with different customer responsibilities or lines of reporting, this will allow you to see how profitable each TAM’s portfolio of accounts is by month.
Time Entry Benchmark
An incorrect URL on the Report Information page had been used (which you’d find if you drill down), and refreshing the report with this updated one will correct the error. This one is just a fix so nothing is broken. No screenshot, but we’ll update it for you.
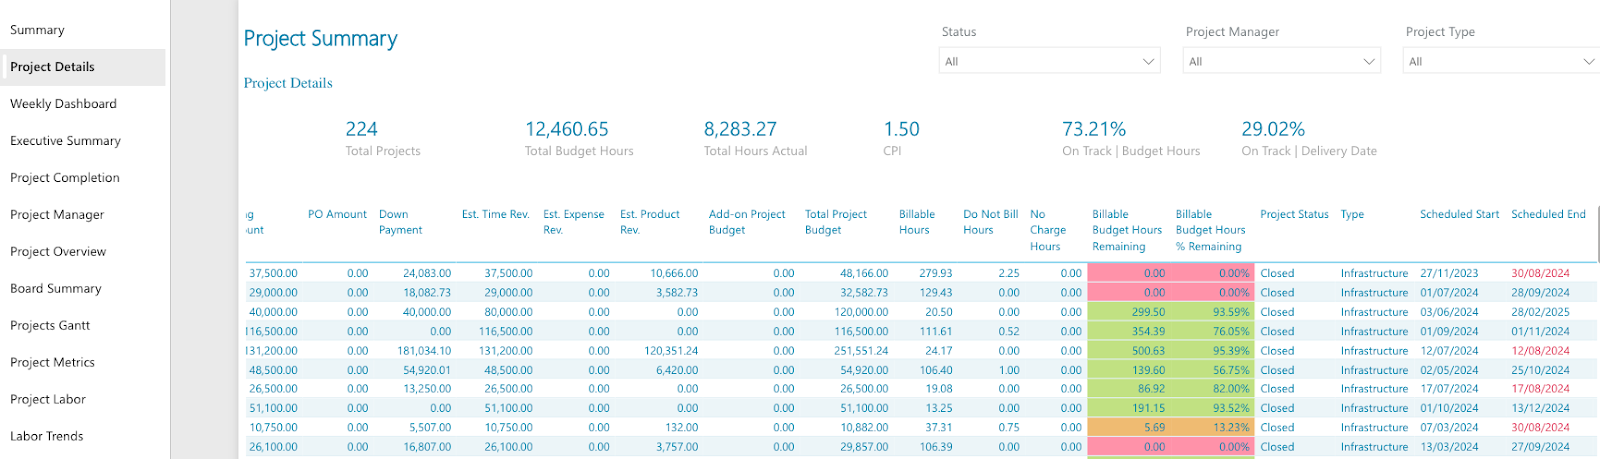
Project Summary Report
Saving the best for last, but unrelated to Vanessa Williams, three enhancements have been made to Project Summary Report’s main Project Details page that improve oversight for projects:
Billable Budget Hours Remaining and Billable Budget Hours % Remaining
Billable Budget Hours Remaining and Billable Budget Hours % Remaining have been added to the Project Details page of the Project Summary report. These two measures will indicate the Billable Hours compared to the budgeted hours for the project. This shows at a glance whether billable hours are over or under budget, how many billable hours are still left in the budget, and the percentage of remaining hours of budget.
This enhancement is useful for MSP project managers to communicate with stakeholders, allowing them to quickly highlight projects in the portfolio that are going well and get ahead of issues that have arisen on others (perhaps scope issues with the client, or resource challenges with internal team members).
We’ve also added Project Management Hours and Engineer Hours to the Details page of the report. Again, this is great for portfolio-level project oversight – understanding overhead requirements / overruns and getting an at-a-glance look at the technical resources individual projects have consumed versus estimates / budgets for each. Take action on any projects that are moving in the wrong direction before they’re on fire.
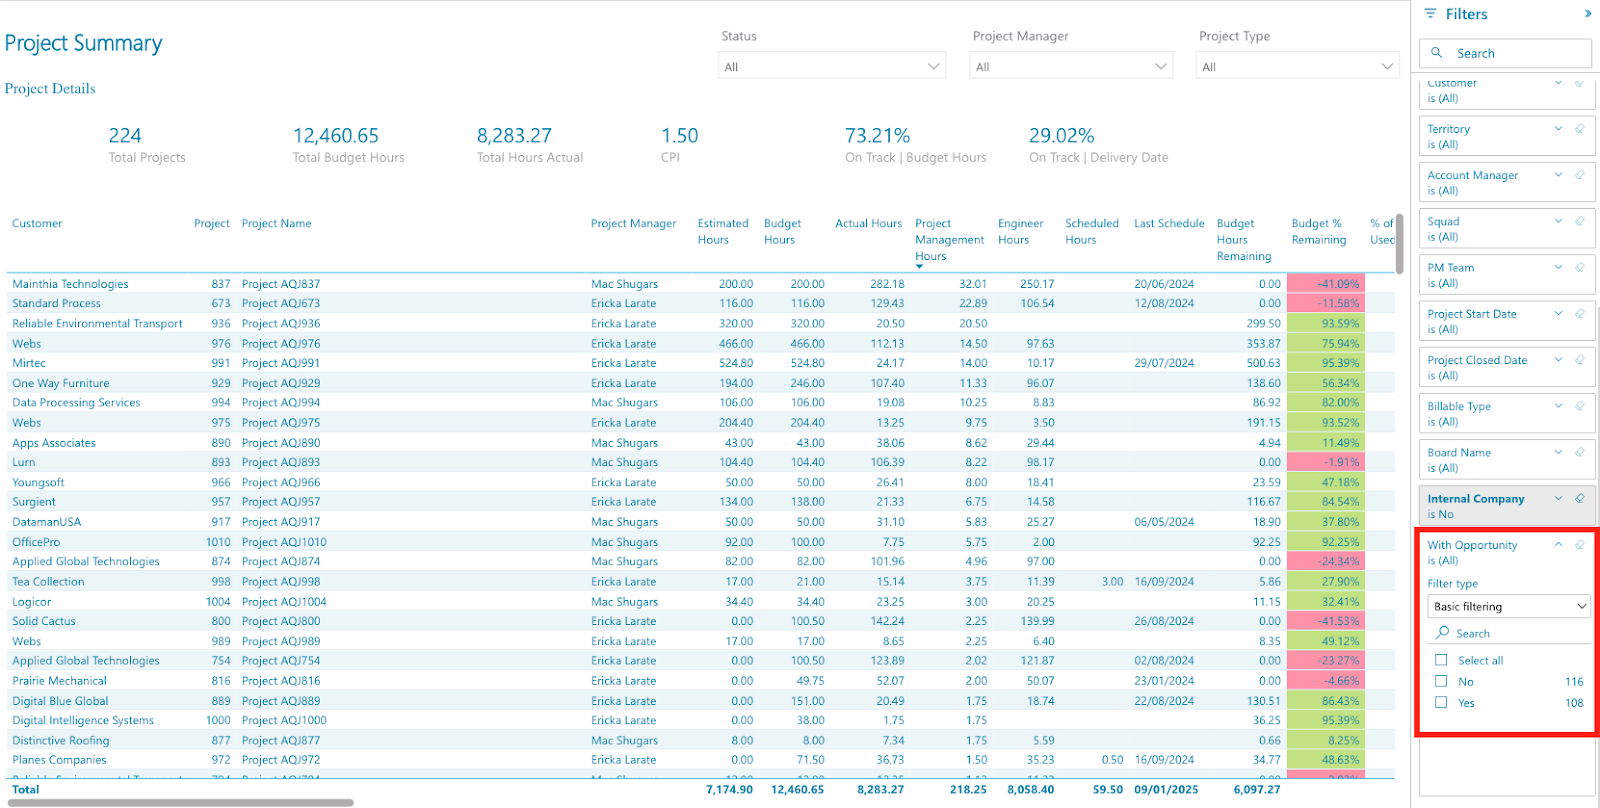
Project Summary Report – new with opportunity filter
A new With Opportunity filter has been created, which will allow you to view only projects with associated Opportunities that have been created in your PSA, or see those that don’t have any Opportunities at all. This will let you see projects that just got missed on updating Opportunities on the sales process side (or just aren’t linked correctly), or if you’ve moved ahead with a client-sourced project that wasn’t “sold” and never had an Opportunity at all (like a surprise office move).
Cognition360 has released enhancements to 4 reports that provide your MSP with improved analysis of your operations and financial measures, including two core reports. Just like the set of reports we updated in March, however, you have to ask for them to get them.
Let’s take a quick look at each of the new-and-improved reports and see exactly what’s new and improved.
Which four reports exactly?
Here’s the list:
Opportunity Dashboard (core report)
Agreement Renewals Report (core report)
Service Profitability Report (add-on)
Ticket Daily Stats (add-on)
You might not be using all of these reports now, but they’re all well worth a second look.
I’m interested… how do I actually get access?
The Cognition360 Support team’s got what you need. If you know exactly what you want, you can fill in this form and request to have the report you want updated to the latest version. Next step, you’re in and using them.
What’s new-and-improved in each of these four reports?
The official word from our Product team is that “these improvements will improve customer retention, enhance your quality of life, and empower you to make more informed and strategic business decisions.”
Are we over-promising? I’d sure like to enhance the quality of my life. Read on to learn more about each; you be the judge.
Opportunity Dashboard
Yes, we just updated this a few months ago, but it’s even better now.
The Opportunity Dashboard now shows the latest conversion stage with the latest conversion value. This will help avoid any confusion, as it will only show the latest stage and value instead of multiple conversion stages with different values. Feedback was that the granularity of multiple conversion stages was more trouble than it was worth.
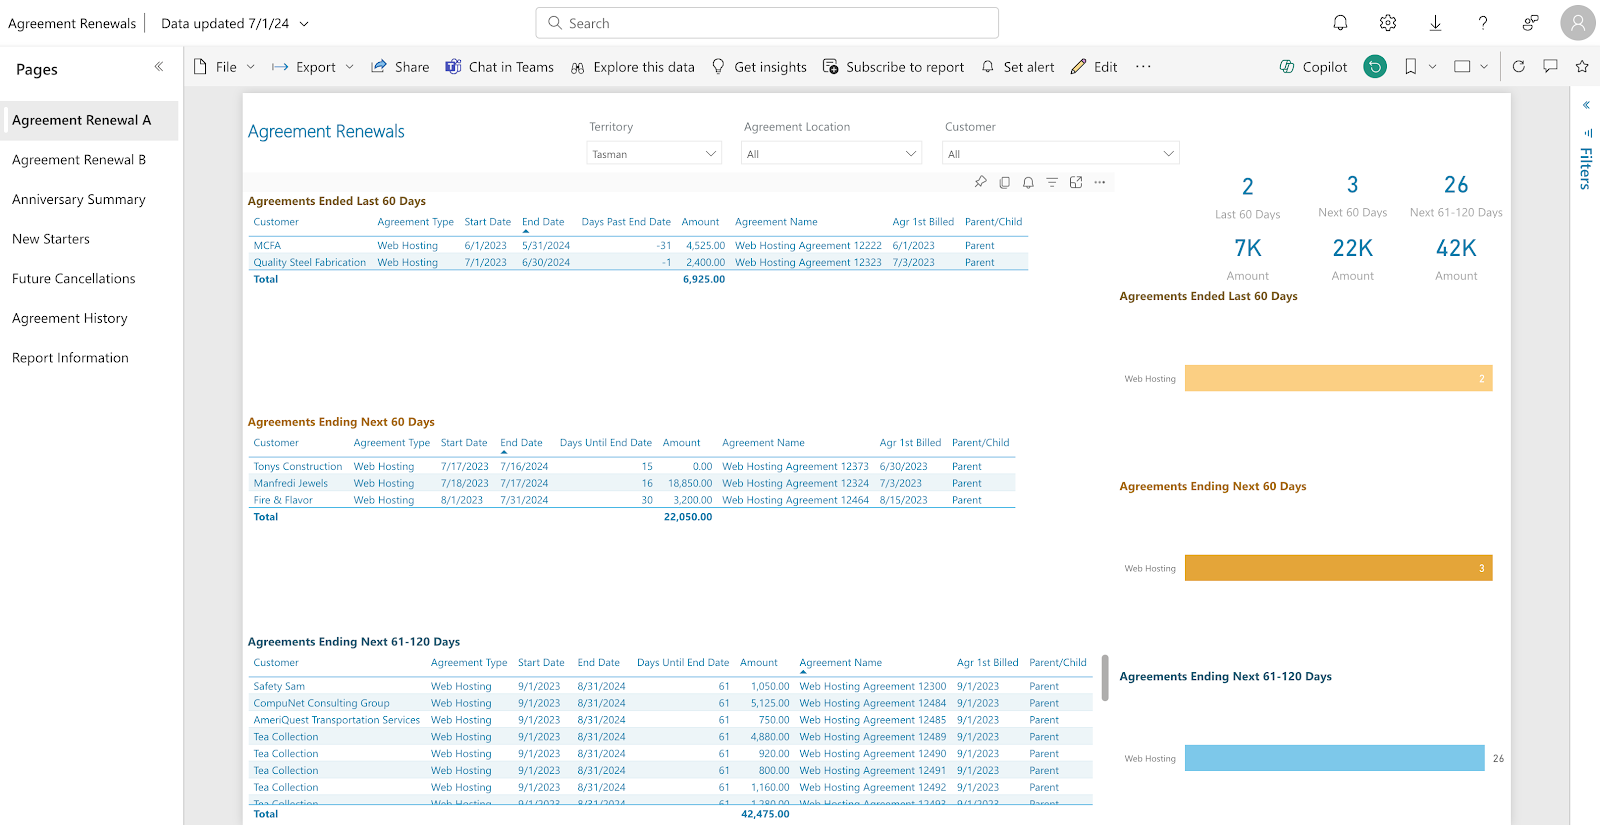
Agreement Renewals Report
The report now uses the actual last invoiced amount to improve accuracy.
The enhancement to the Agreement Renewals Report improves it to use the actual last invoiced amount as renewal amount instead of amount of the agreement. This better represents true renewal values, as the actual amount can be different from agreement amount. This allows you to see the effects of discounts or deals – how much are your clients actually being charged?
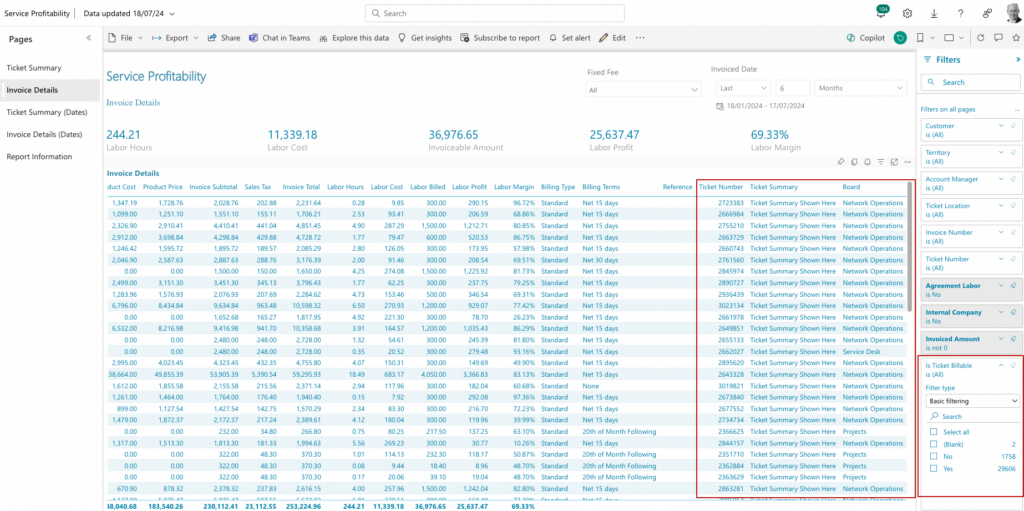
Service Profitability Report
The Service Profitability Report has been updated with ticket summary, board, and billability status.
The report itself has been updated to display Invoice Details with a ticket summary. Scroll to the right, and you’ll see an at-a-glance overview of each ticket, and the ability to sort by which board tickets were assigned to – another way to look at cost/profit/margin by ticket on each service board.
A "Is Ticket Billable" filter has also been added, allowing you to filter out ticketed-but-non-billable work that you may choose not to include in your profitability reporting. This allows you to maintain best practices of tracking all work with tickets and time entries without distorting your margin measures; for example, when team members may be assigned to non-revenue internal projects.
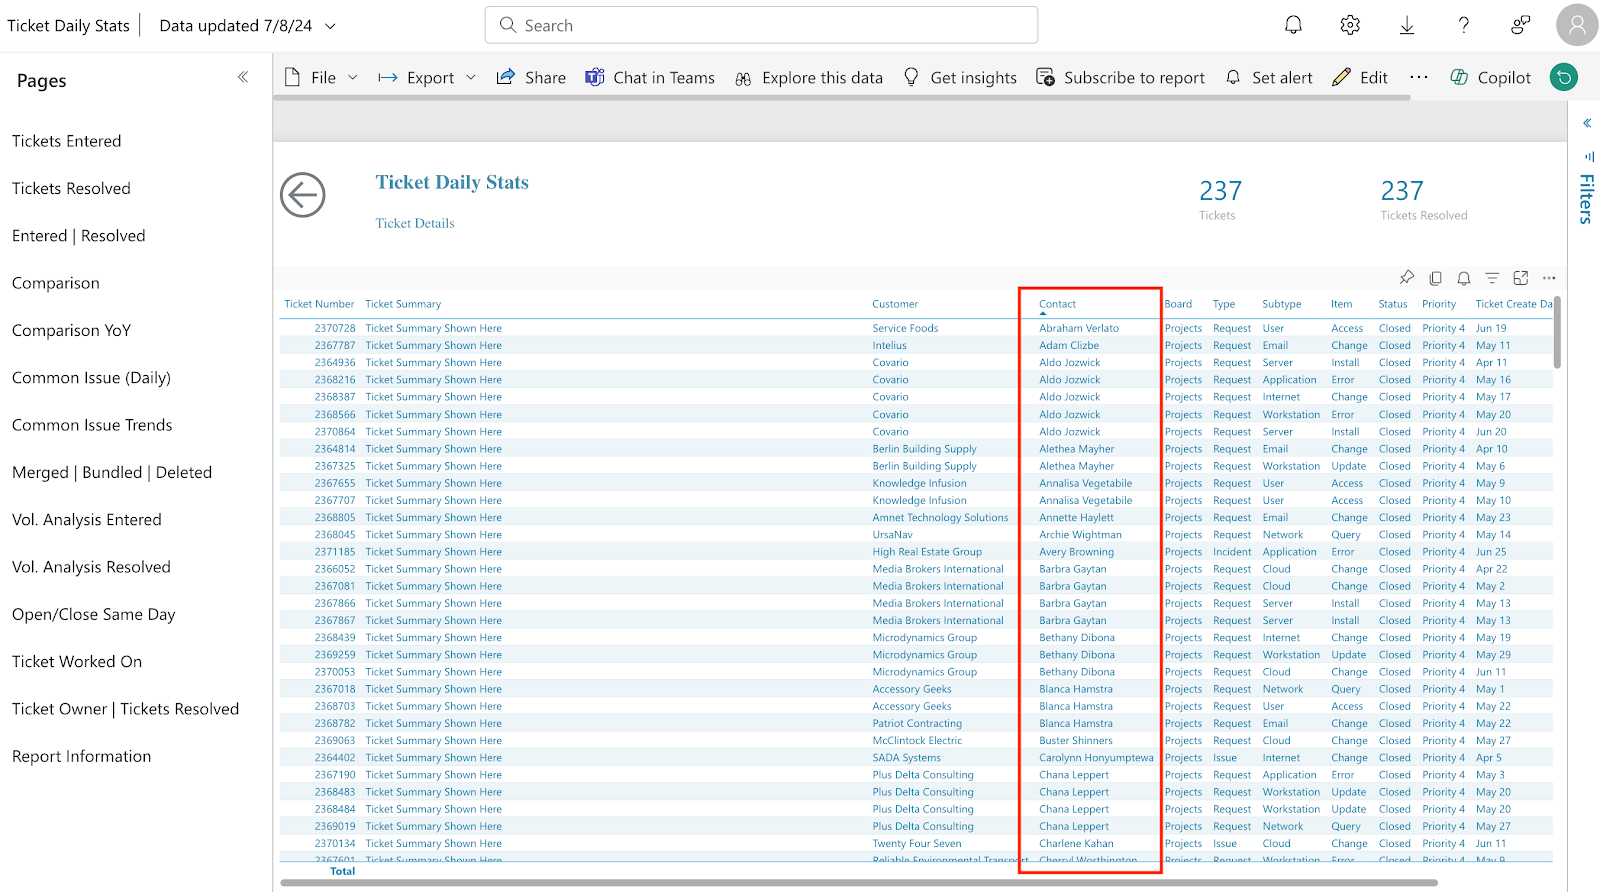
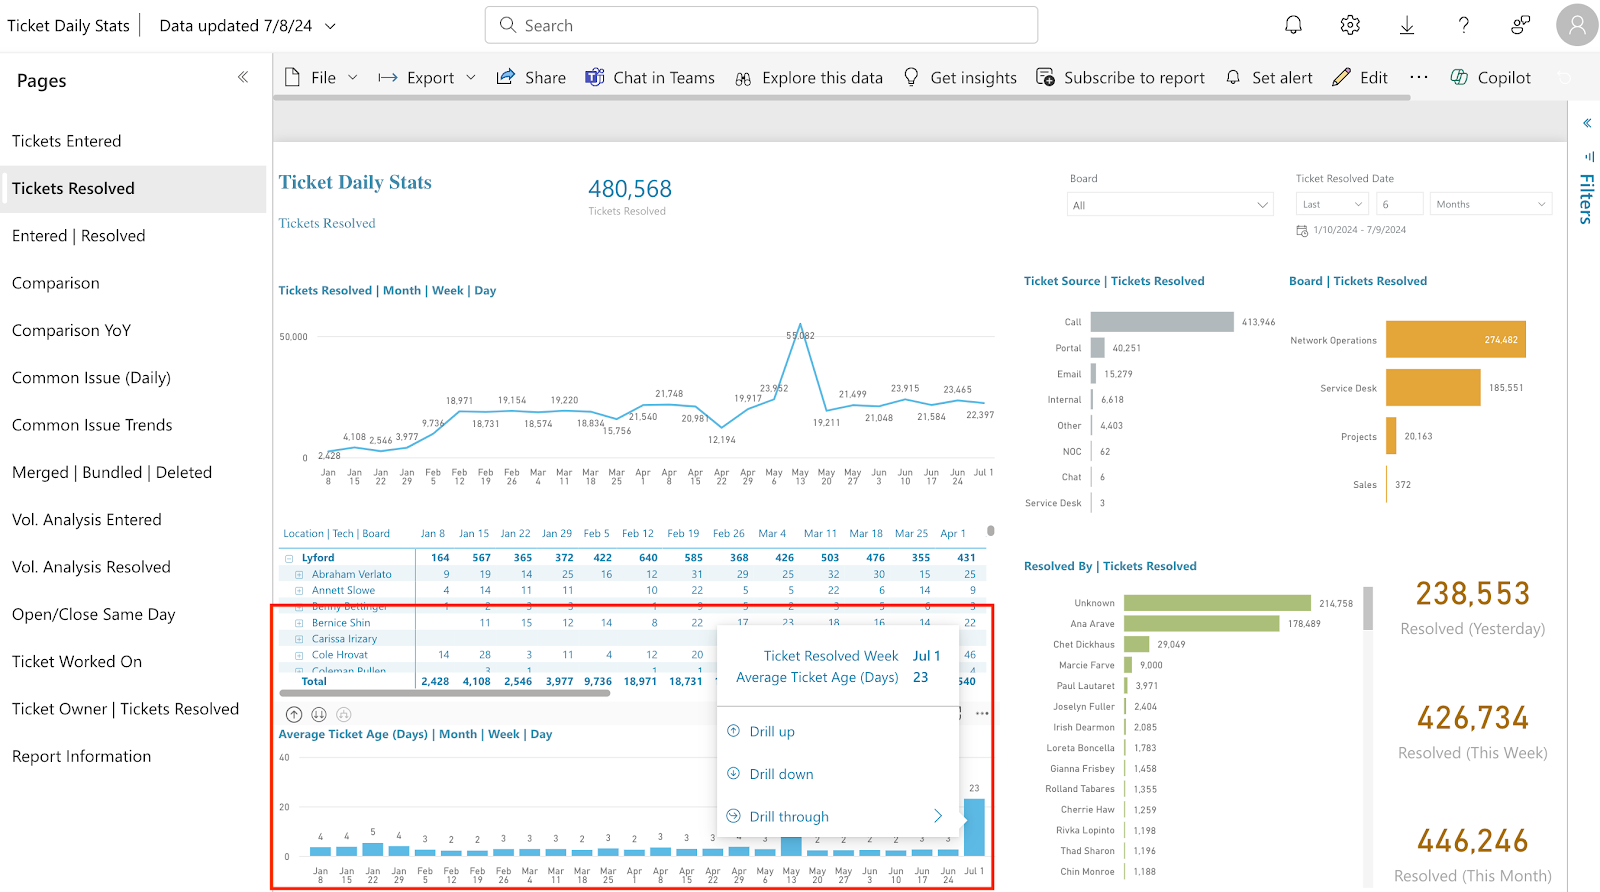
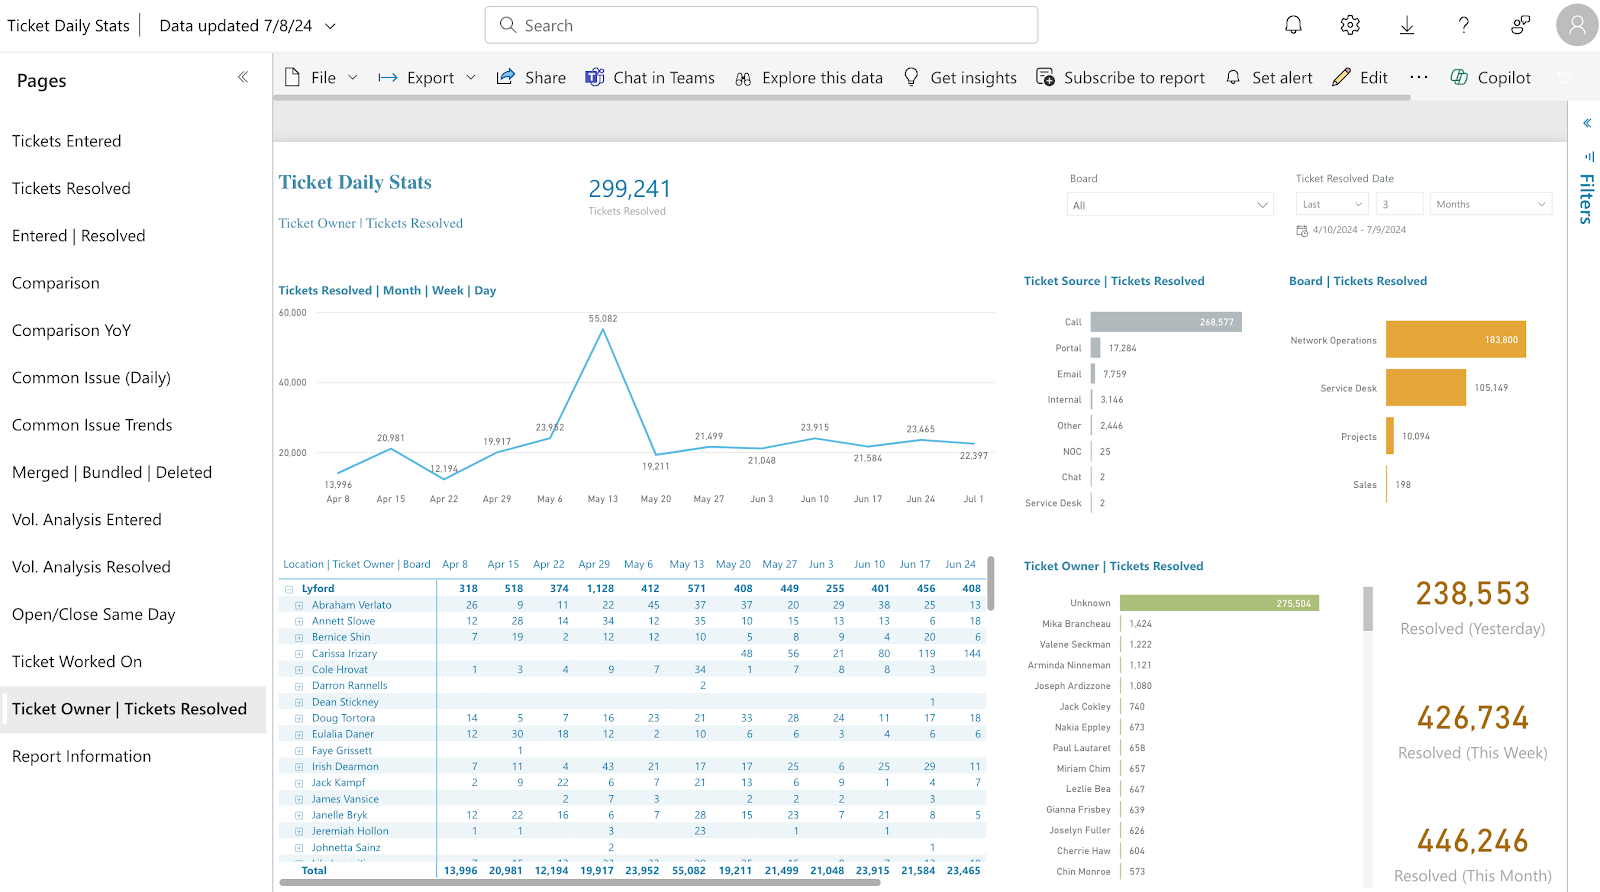
Ticket Daily Stats
Three enhancements have been made to Ticket Daily Stats:
Identify the ticket contact and submitter
Average age of tickets
Ticket owners can now see resolved tickets
Ticket Daily Stats – Ticket Details showing Contact for each ticket
Want to see right from the Ticket Daily Stats report who’s been sending in tickets and get a hold of them for follow up? Contact is now listed right there.
Ticket Daily Stats – Tickets Resolved showing average ticket age
The Tickets Resolved page now displays the average age of resolved tickets and compares the average age of those resolved tickets by day, week, and month. The Ticket Age calculates the time elapsed between the ticket creation date and the resolution date.
A new page, Ticket Owner | Ticket Resolved, allows a ticket owner to see all their resolved tickets, regardless of who actually resolved them. Perfect for when you’re coming back from summer vacation and you want to know who to thank for closing out some tough ones.
Cognition360 has released 7 enhanced reports that provide your MSP with improved analysis of your operations and financial measures, leading to improved efficiency and profitability… but you have to ask for them to get them.
Let’s take a quick look at each of the new-and-improved reports.
You might not be using these reports now, but they’re well worth a second look.
I’m interested… how do I actually get access?
The Cognition360 Support team’s got what you need. If you know exactly what you want, you can fill in this form and request to have the report you want updated to the latest version. Next step, you’re in and using them
What’s new-and-improved in each of these 7 reports?
Some are small tweaks, like added filters, while others have entirely new pages added to them. Read on to learn more about each.
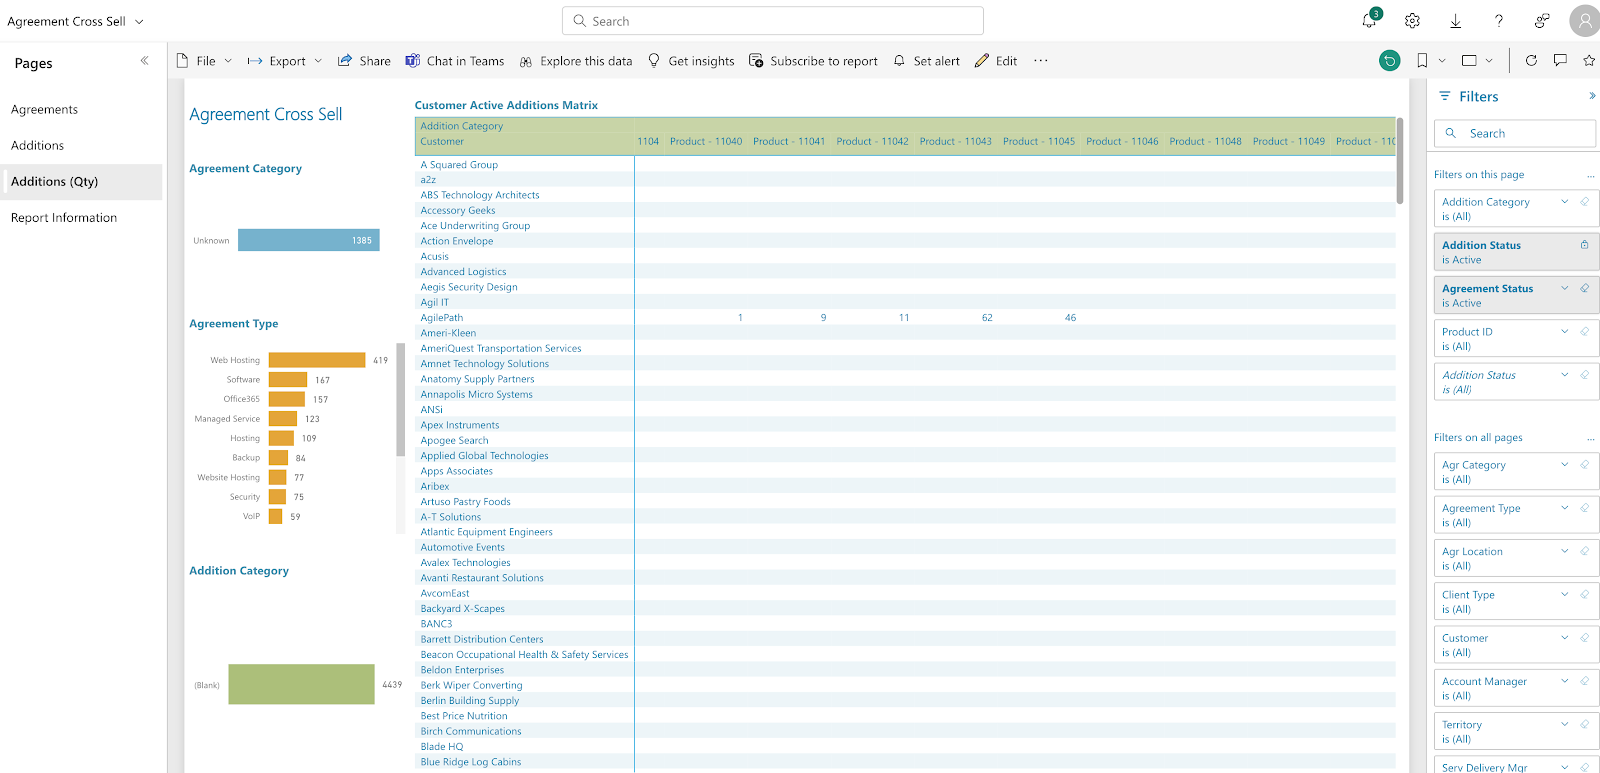
Agreement Cross Sell Report
You’ll see two changes here: an additional page called ‘Addition (Qty)’, and the validation of summary quantity.
As you look to cross-sell new products to your clients, you want to know not only which products have been sold through the agreement but also quantities of each product sold. By including product quantities, you have a more accurate depiction of exactly what has been purchased through the Agreement.
Fill in this form and request to have the report you want updated to the latest version.
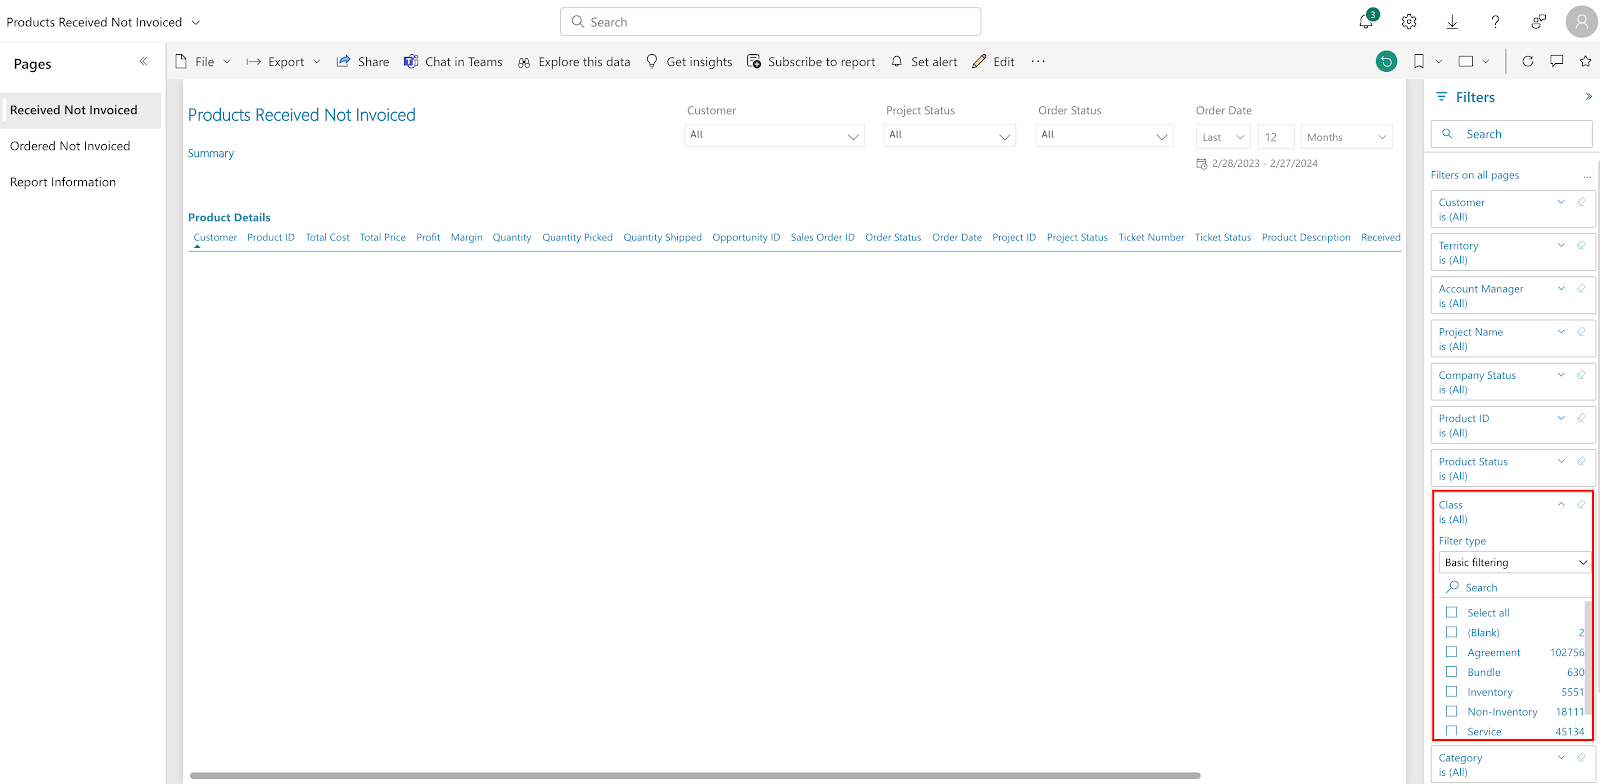
Products Received Not Invoiced Report
A new filter enables inclusion or exclusion of Product Classes, which allows you to identify if specific products have been invoiced or not.
Say your MSP has received the latest invoice from a vendor, and you want to cross-reference the number of products you are being billed for against the number of products you will be invoicing your clients for. Now you have an easy way to do just that.
Fill in this form and request to have the report you want updated to the latest version.
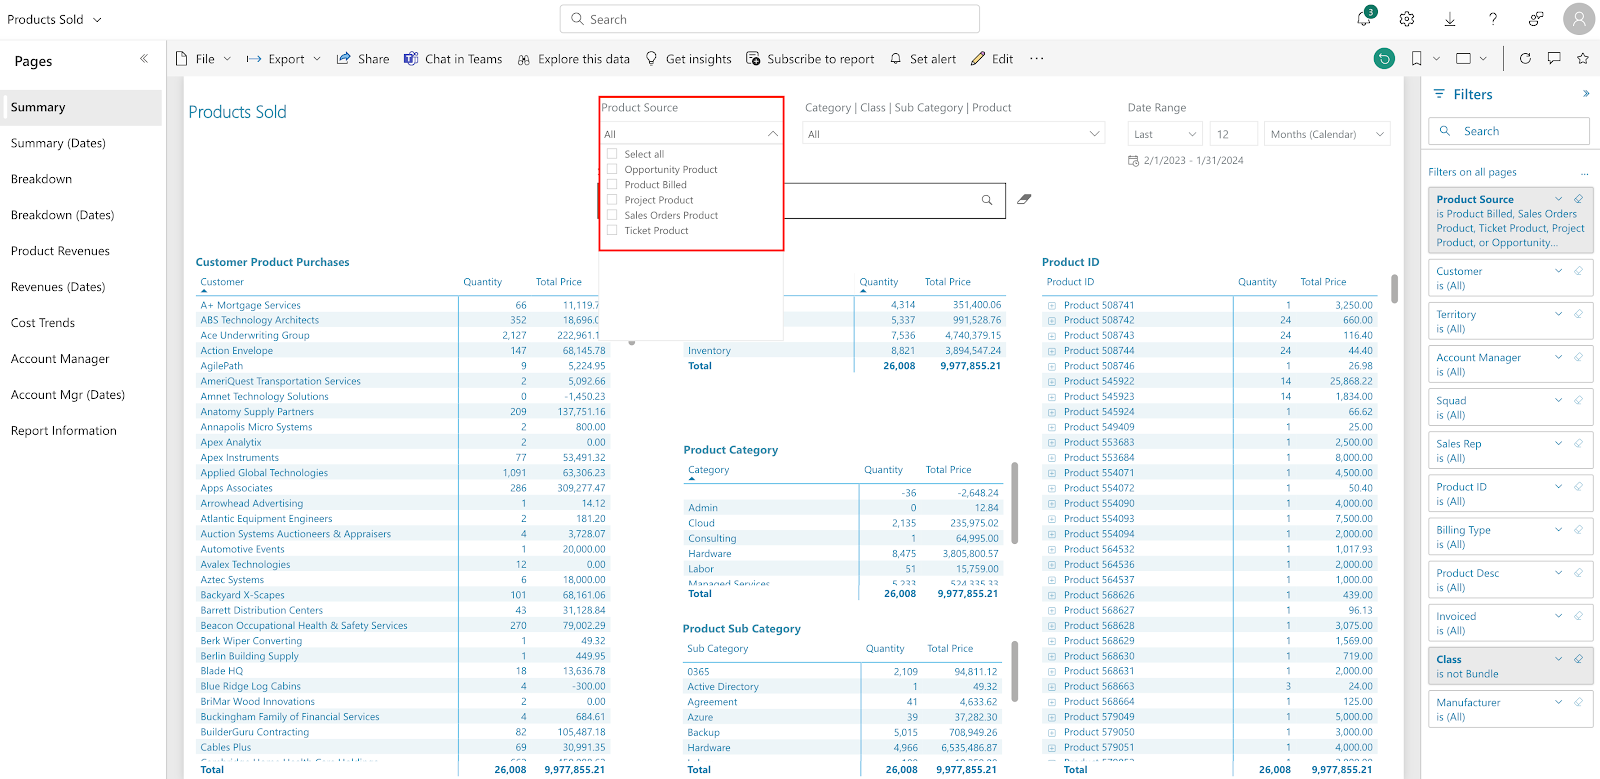
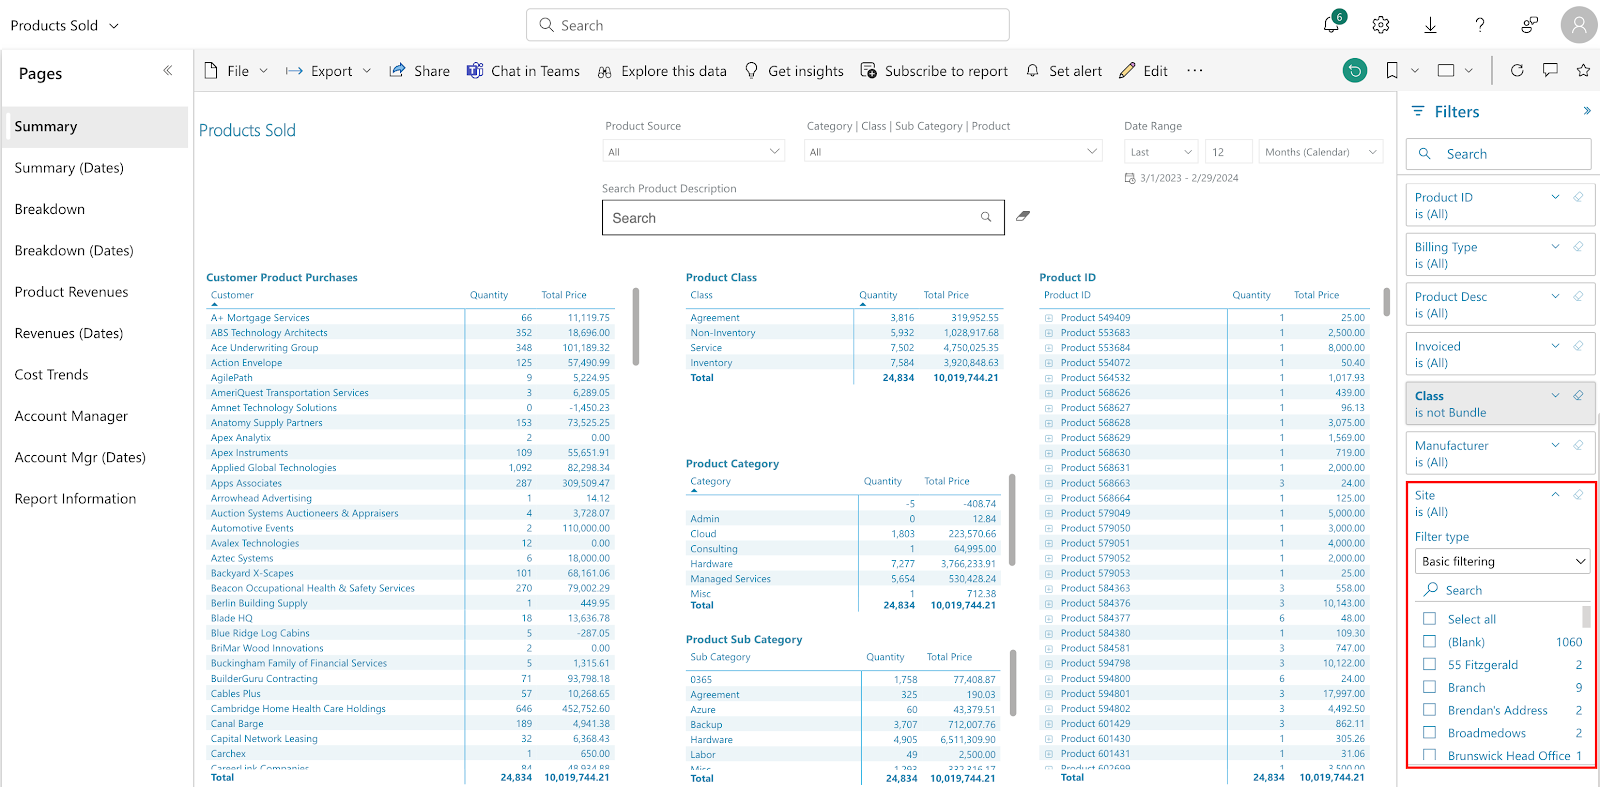
Products Sold Report
Not one, not two, but three updates here. First, this update improves the performance of the Products Sold Report. If that wasn’t enough, we’ve added data validation for products sold on Opportunities, Sales Orders, Projects and Tickets. And last but not least, we’ve added a filter for ‘Site’.
‘Product Source’ data validation
Generating the report quicker – think it’s obvious why you’d want that – and the selectable data validation field lets you only see what you want to see.
‘Site’ filter highlighted
‘Site’ filter: if your MSP has multiple sites, like an East Coast office and a Midwest office, this new filter option presents products sold by site instead of only to clients in total. This way, you could see the sales split between the two site locations to compare performance.
Fill in this form and request to have the report you want updated to the latest version.
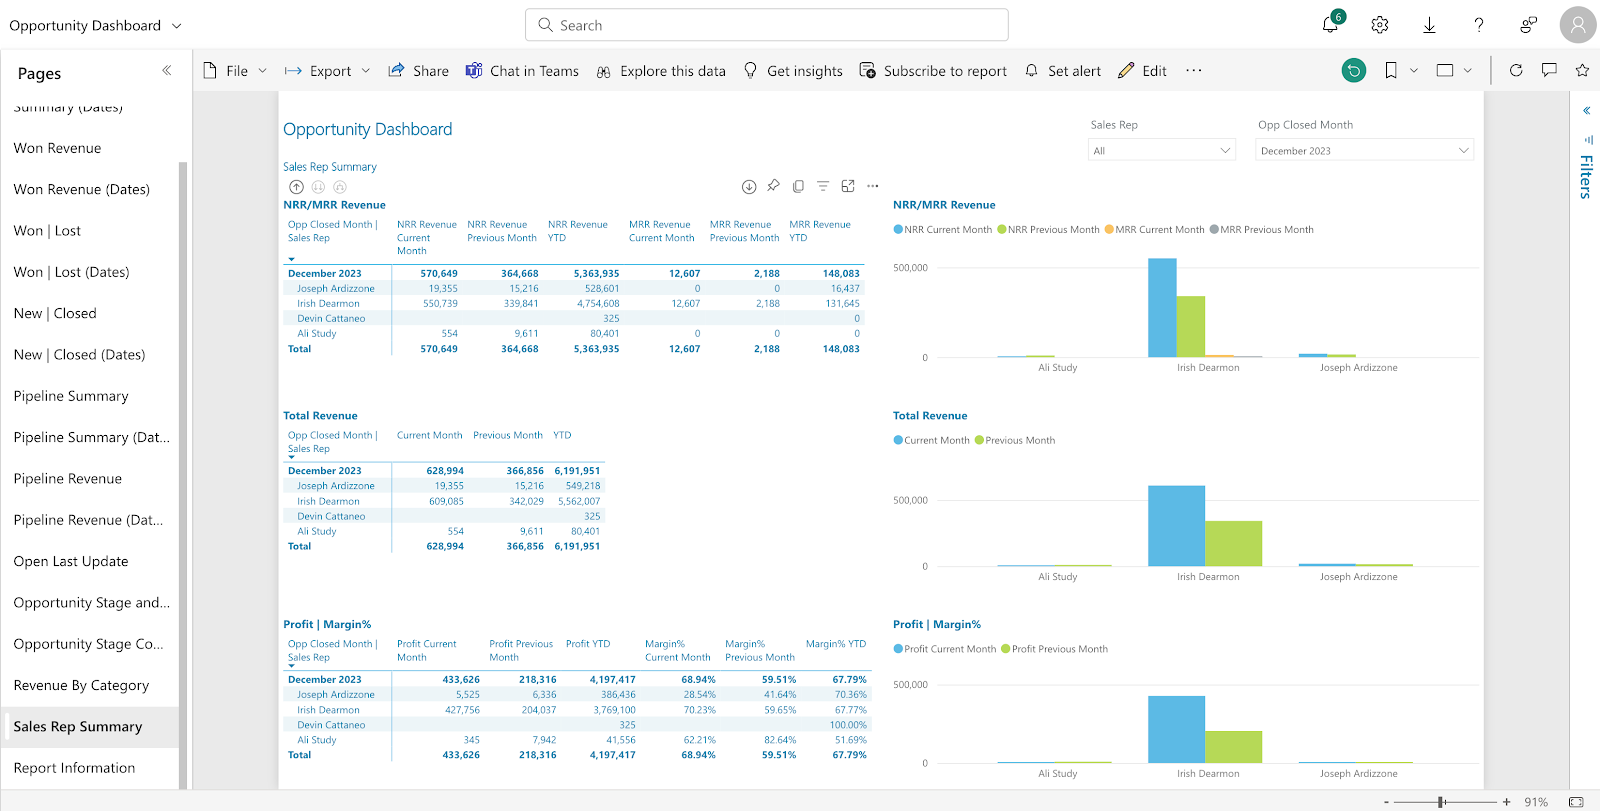
Opportunity Dashboard
Here we’ve added a new page called 'Sales Rep Summary'. Sales Rep Summary shows won opportunities per rep by month. This includes total and Lifetime NRR and MRR as well as profit and margin percentages for the current month, the previous month, and YTD:
Sales Rep Summary better presents the key closed opportunity sales performance metrics of each of your MSP’s sales reps by month. This enables more in-depth review and analysis of month-over-month sales. It’s excellent for improving performance – coach for improvement, and celebrate the wins.
Fill in this form and request to have the report you want updated to the latest version.
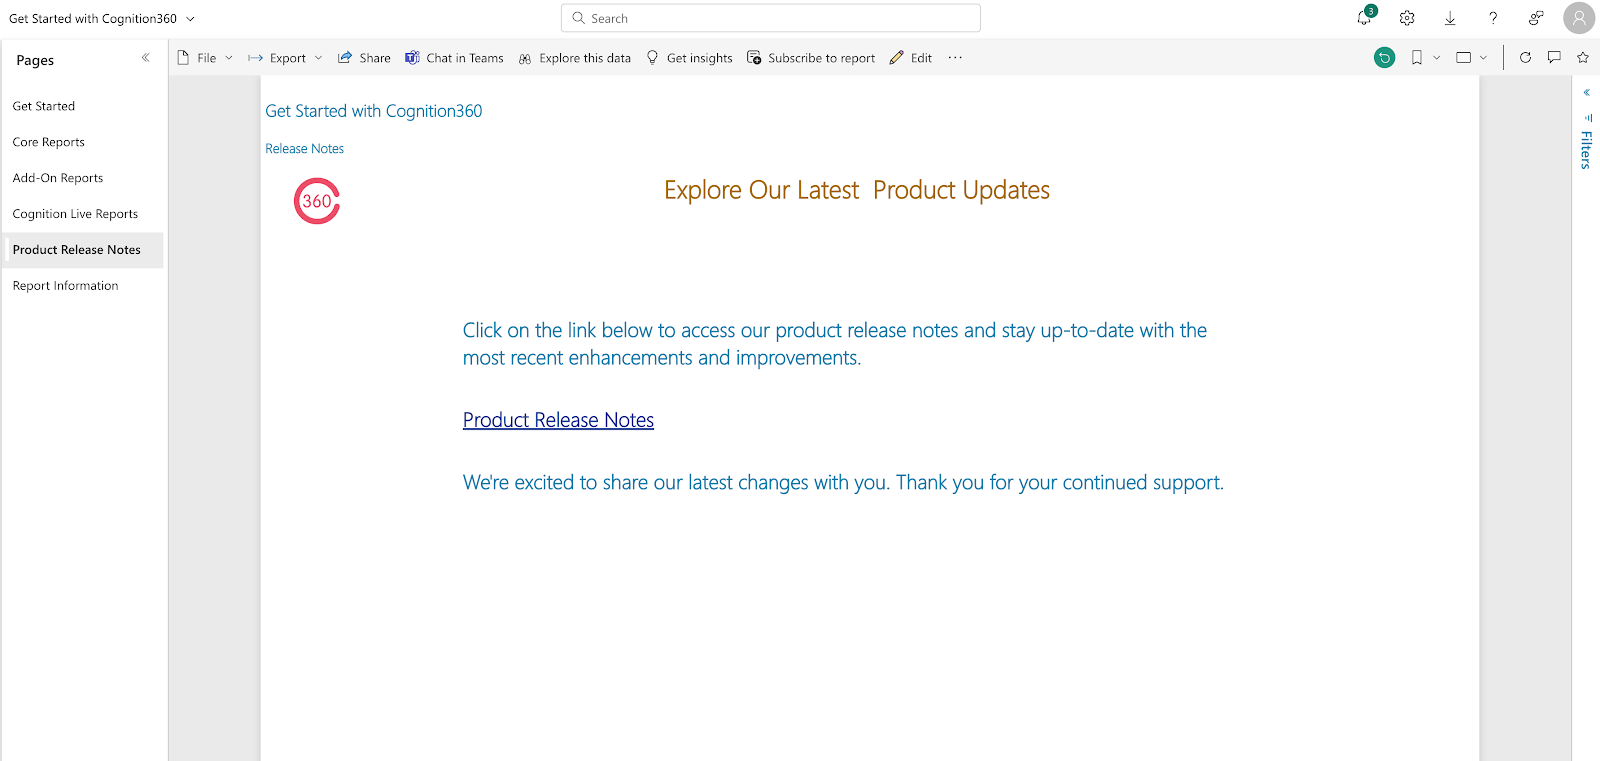
Getting Started Report
The updated Getting Started Report adds a new page 'Product Release Notes', which gives you a direct link to the ScalePad Community Product Updates page, where you can find out about future releases… like this one!
Perhaps we should have put this at the top of the list as it’s a place to get started… 🤔. At any rate, use this handy mailto: link to get access, and never miss another update, as you’ll find them all on our Community site.
Fill in this form and request to have the report you want updated to the latest version.
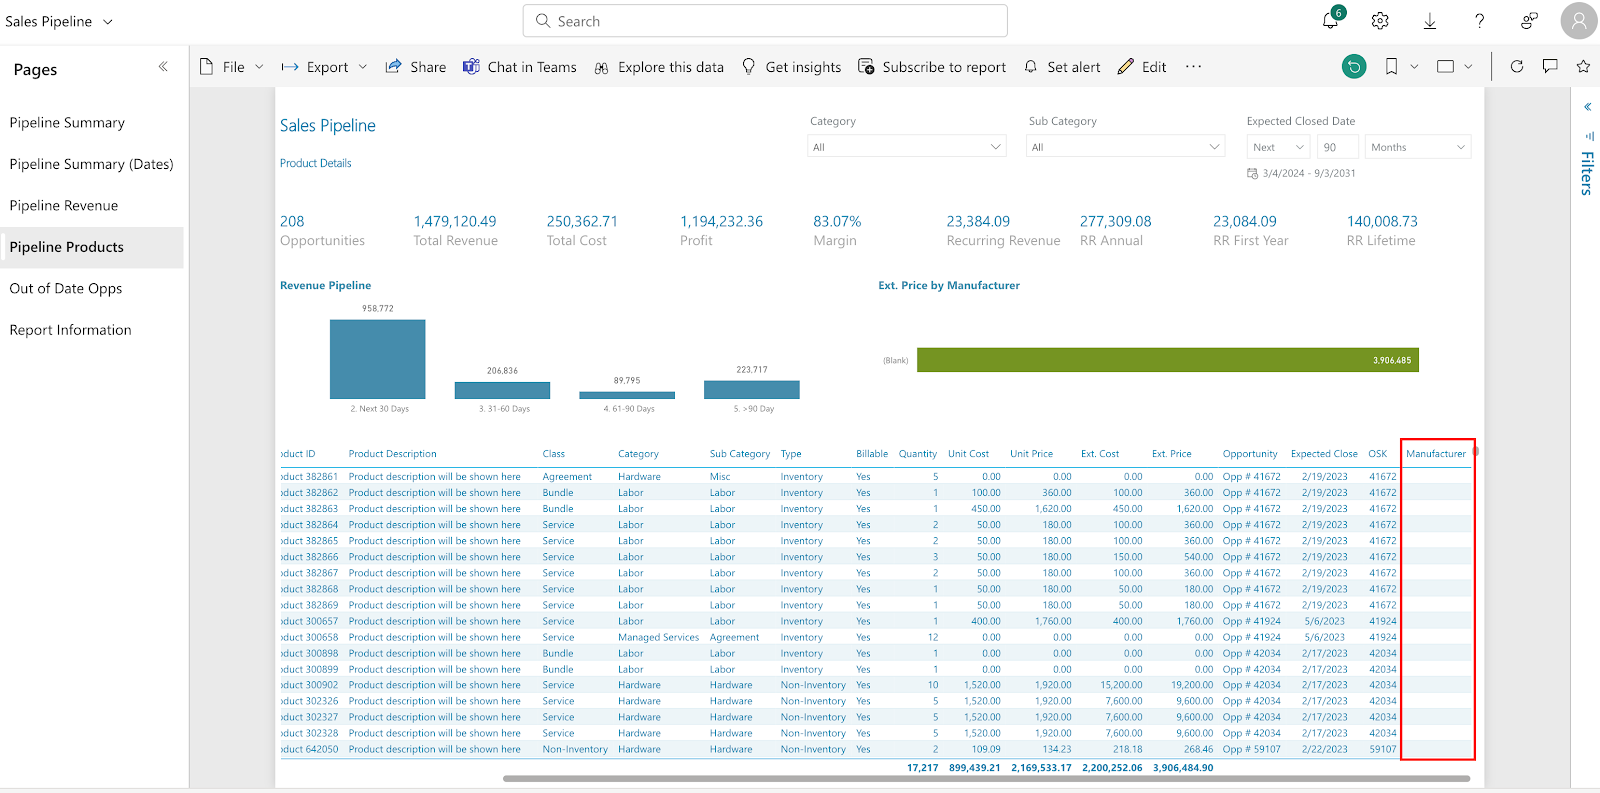
Sales Pipeline Report
Here we’ve added a new field called 'Manufacturer' which, as the name suggests, permits viewing revenue info by OEM.
Why might you want this? Perhaps you’re looking to deprecate an existing OEM’s product you had been selling to your clients. This new field will show the potential impact on upcoming or forecasted sales if you decide to deprecate that manufacturer's product(s), and point out where you may need to spend a little extra time to ensure those sales move to the alternative you are selling instead.
Fill in this form and request to have the report you want updated to the latest version.
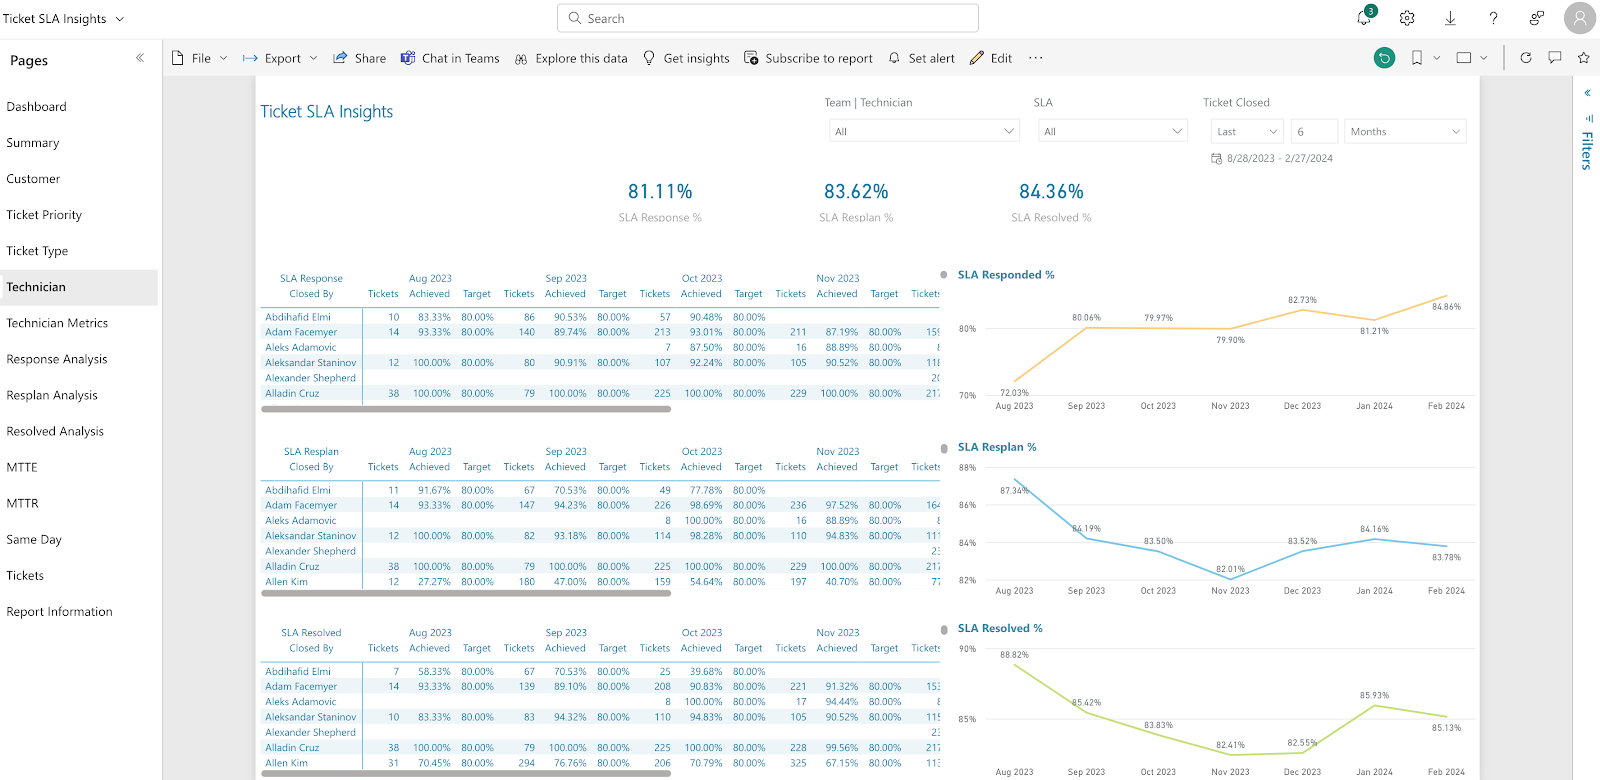
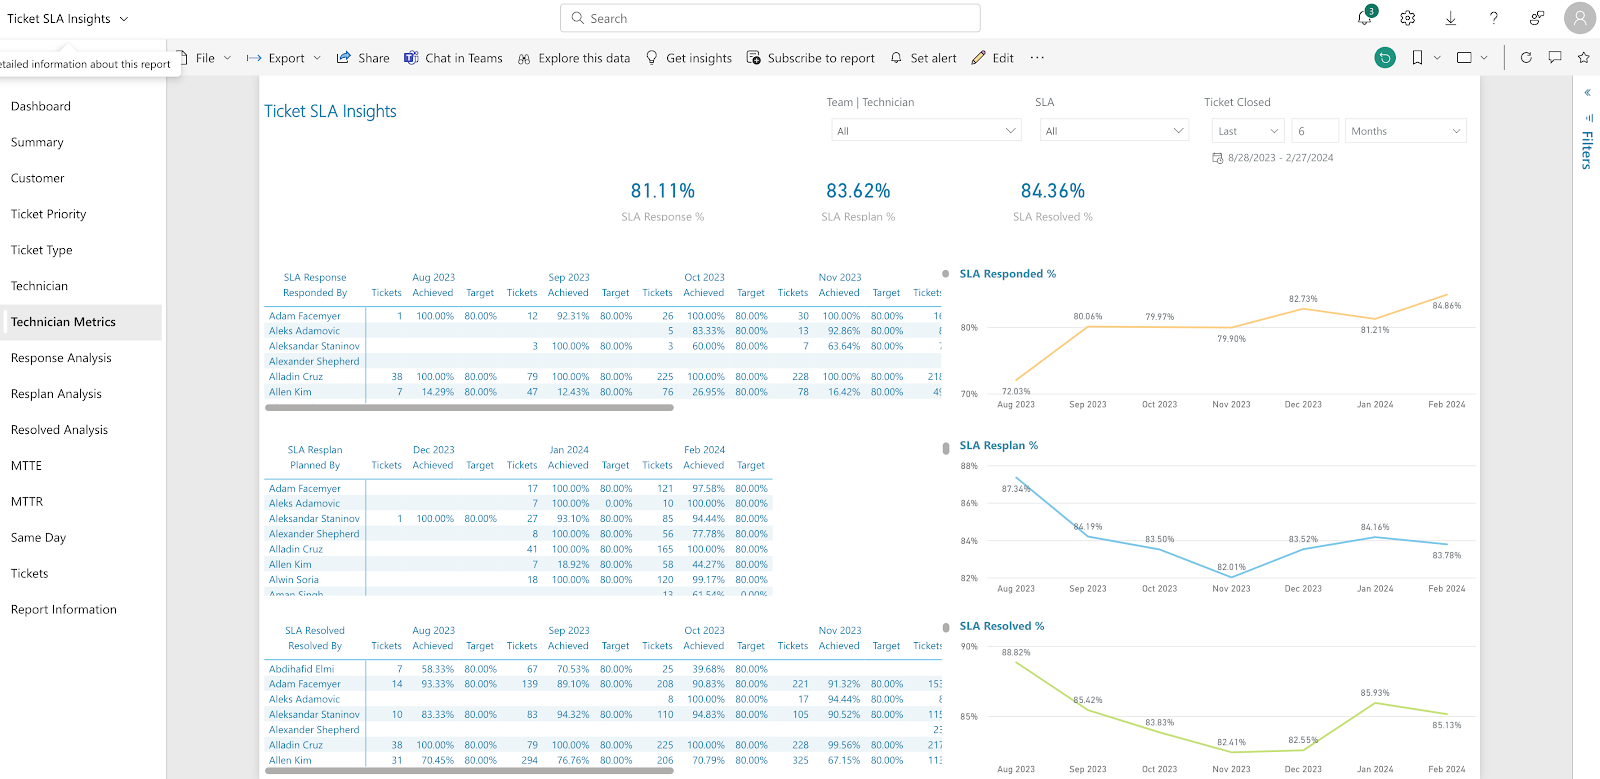
Ticket SLA Insights
Saving the best for last, we have added a new page, called 'Technician Metrics', as an enhancement to the 'Technician' page on Ticket SLA Insights.
'Technician Metrics' shows the SLA Response, Resplan and Resolved values only where the selected Technician were responsible for each of those actions. The visuals on the 'Technician' page shows all values where the selected technician closed the ticket (regardless of which technician was responsible for the other stages of the ticket).
Technician page
Technician Metrics page
Measuring your team’s technicians’ outputs is a key component to a successful MSP practice. For a service delivery manager, being able to review specific technicians’ SLA response times and resolution notes can be a valuable aid in cross-training new technicians and an important management tool.
Fill in this form and request to have the report you want updated to the latest version.
Hope you see a lot of value in the work we’ve done to enhance these reports, and watch this Community Product Updates space for future upgrades!