01
130+ reports
Use prebuilt reports across Agreements, Benchmarks, Customer, Finance, Projects, Sales, and Service Delivery.
- 7 Power BI apps
- 6-15 report pages per app
- MSP-specific reporting
 Reporting
Cognition360 transforms ConnectWise Manage data into 130+ interactive Power BI reports so mature MSPs can ask better questions without rebuilding spreadsheets or slowing down the PSA.
REPORTING LIBRARY
Start with day-one reporting value: a broad report library, a ConnectWise-optimized warehouse, and deeper drill-down than native PSA reporting.
01
Use prebuilt reports across Agreements, Benchmarks, Customer, Finance, Projects, Sales, and Service Delivery.
02
Run analytics from a star-schema data warehouse optimized for ConnectWise Manage instead of loading the production PSA.
03
Give owners, finance leaders, and operations teams consistent reporting for profitability, delivery, and planning conversations.
REPORTING FLOW
Reporting should not stop at a chart. Cognition360 helps teams move from raw PSA data to reports that explain where performance is changing.
Bring ConnectWise Manage entities such as agreements, tickets, projects, time entries, customers, and teams into the C360 data model.
Use a purpose-built warehouse and dimensional model designed for historical ConnectWise reporting.
Work through curated Power BI apps instead of building every report from scratch.
Move from summary metrics into the customers, agreements, tickets, or teams creating the number.
Use the insight to adjust agreements, staffing, service delivery, projects, or client conversations.
POWER BI DELIVERY
Cognition360 is intentionally specific: ConnectWise Manage is the data source, and Power BI is the reporting surface. That makes it a strong fit for MSPs already committed to ConnectWise and Microsoft BI workflows.
ConnectWise-only is a filter, not a footnote.
Analyze MRR, margin, agreement products, and profitability trends.
Roll up customer profitability, interactions, CSAT, and review context.
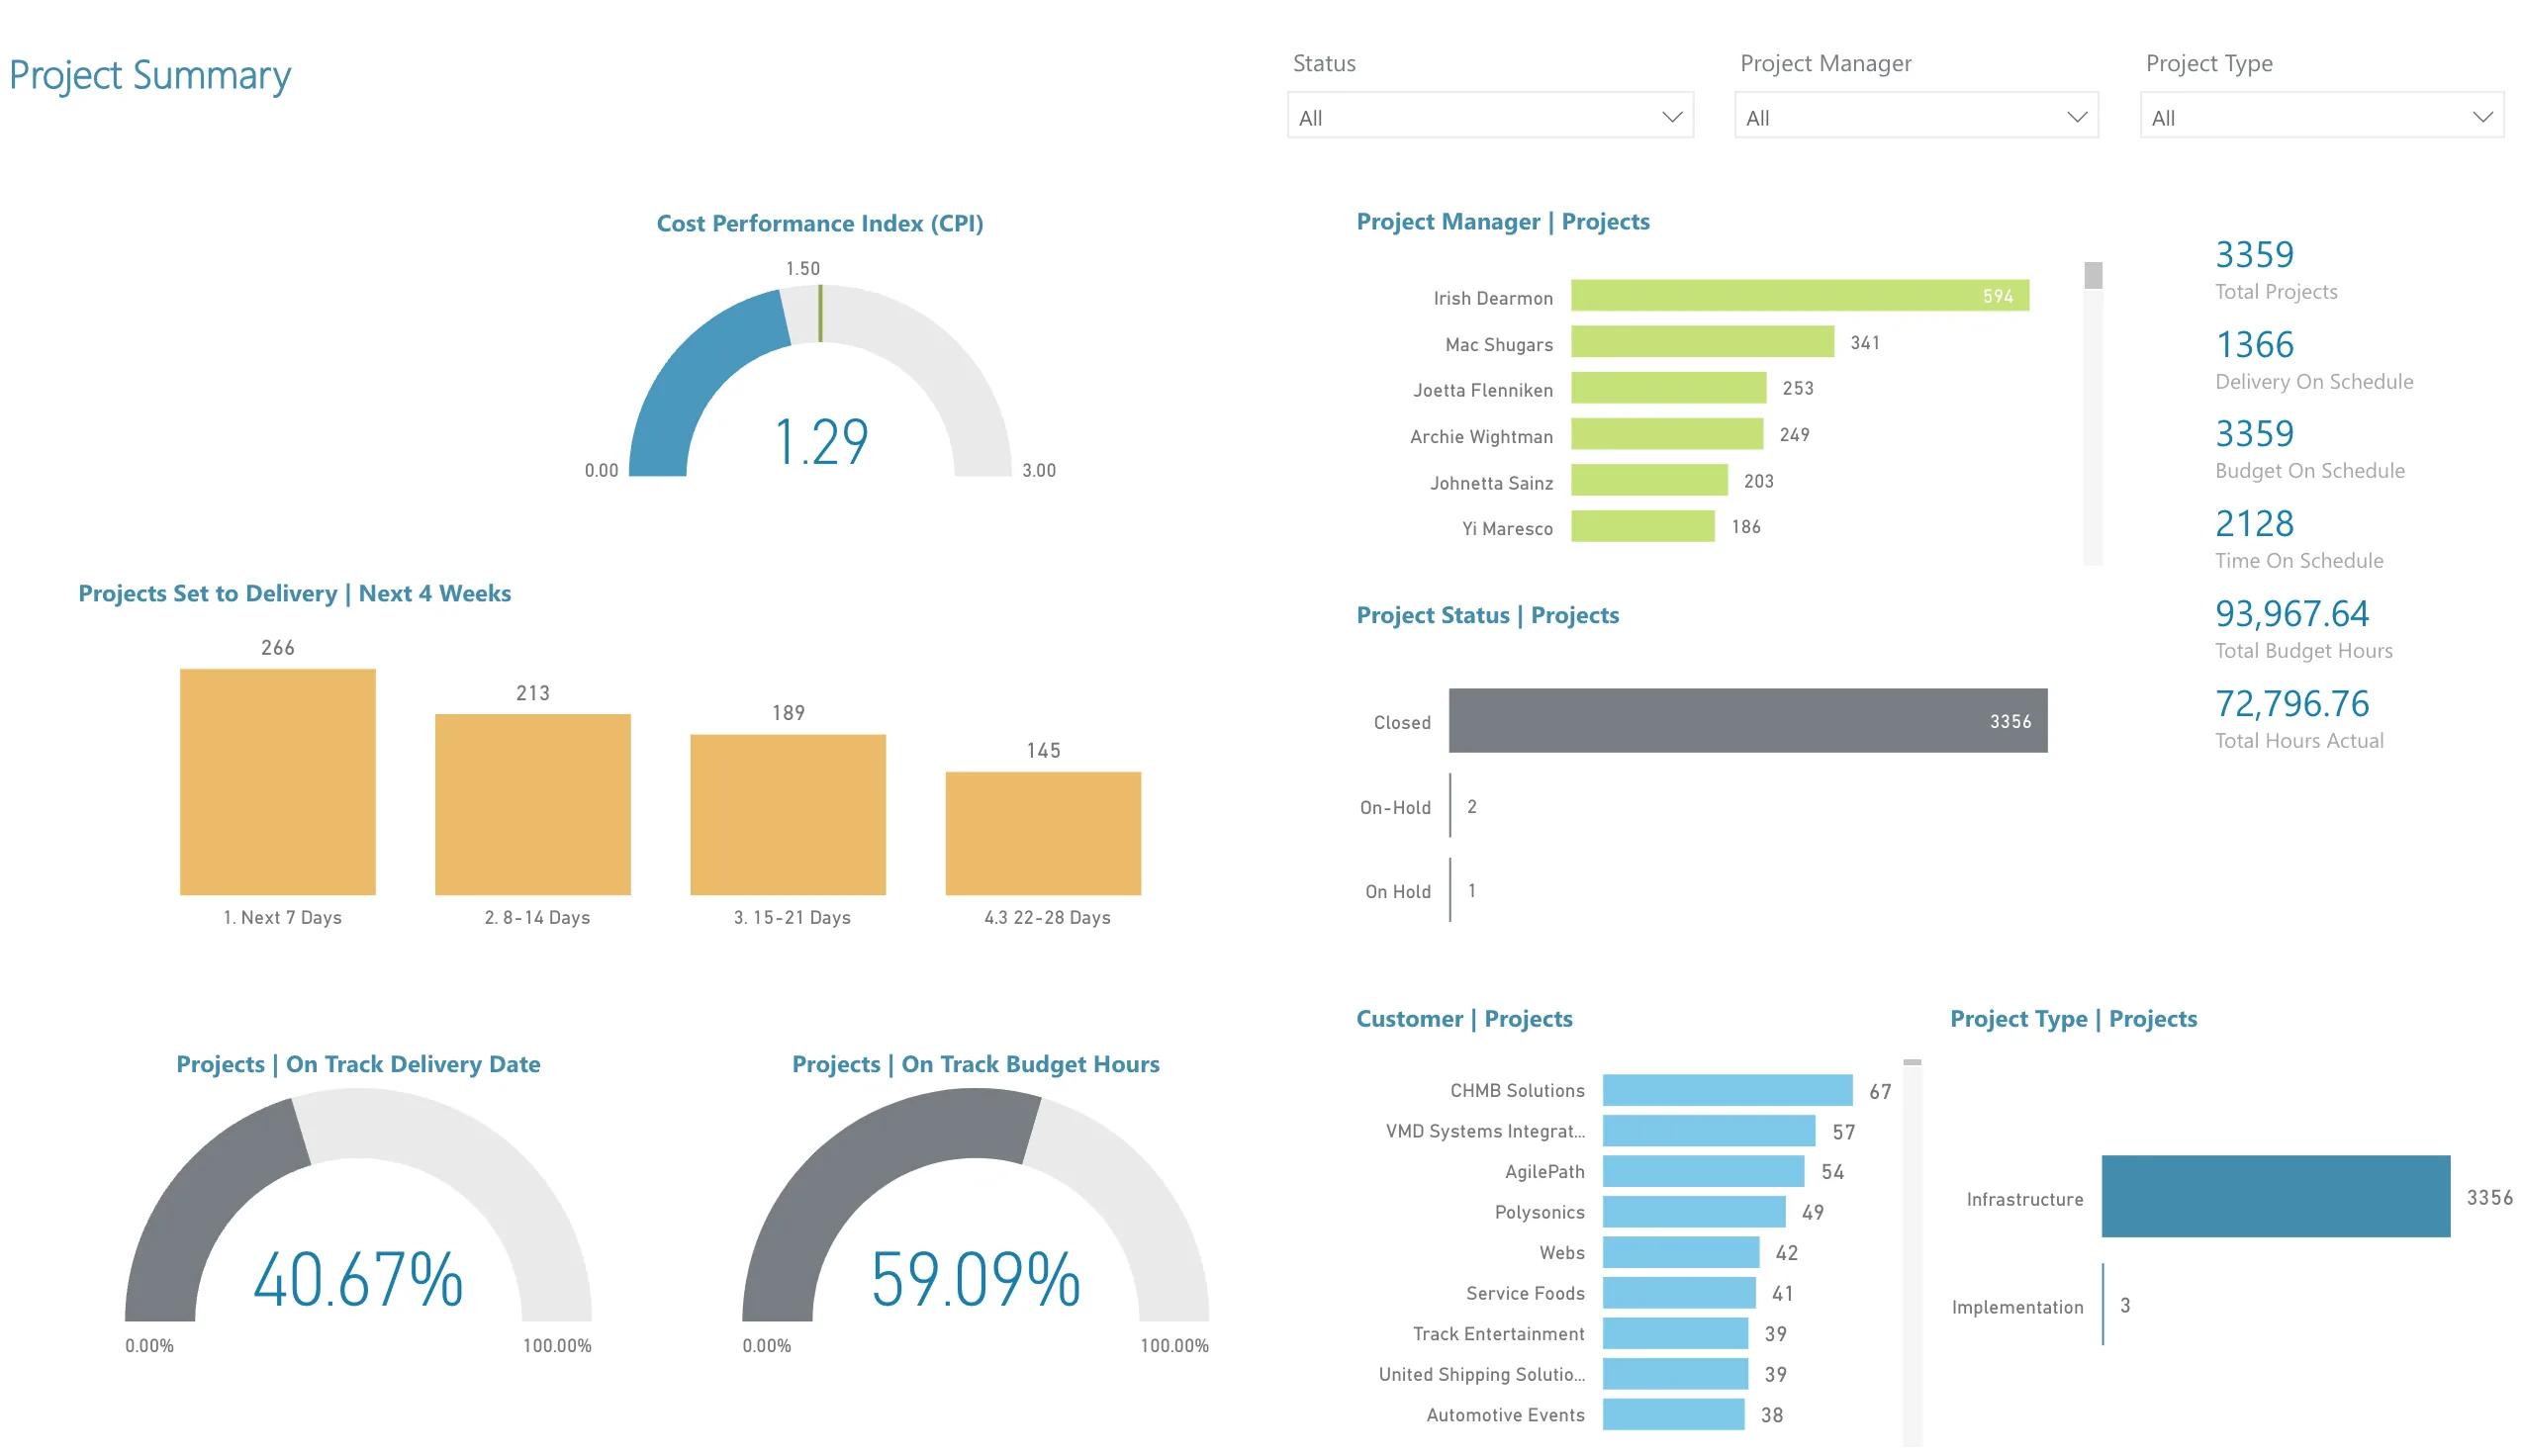
Evaluate active and closed project profitability and labor performance.
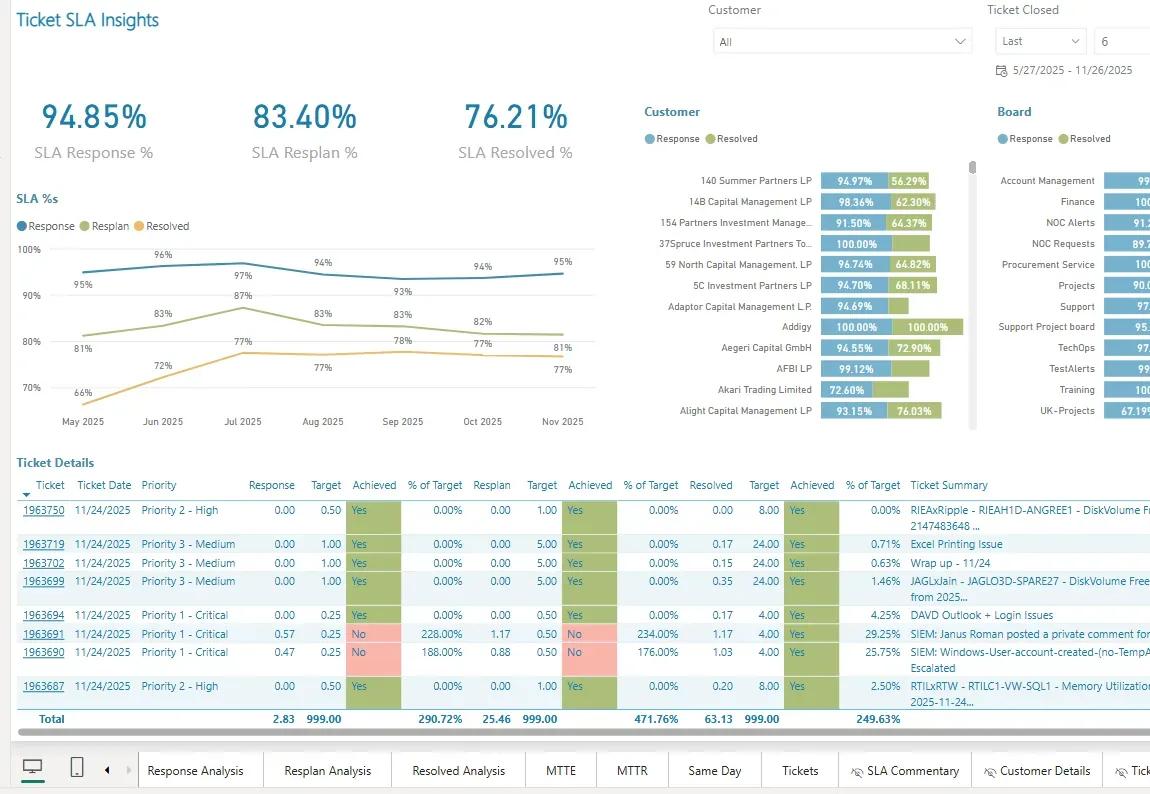
Track ticket lifecycle, technician efficiency, utilization, and common issues.
Monitor financial goals, peer comparisons, and executive reporting views.
CONNECTWISE MSP?
Book a Cognition360 demo to explore Power BI reporting built specifically for ConnectWise Manage.